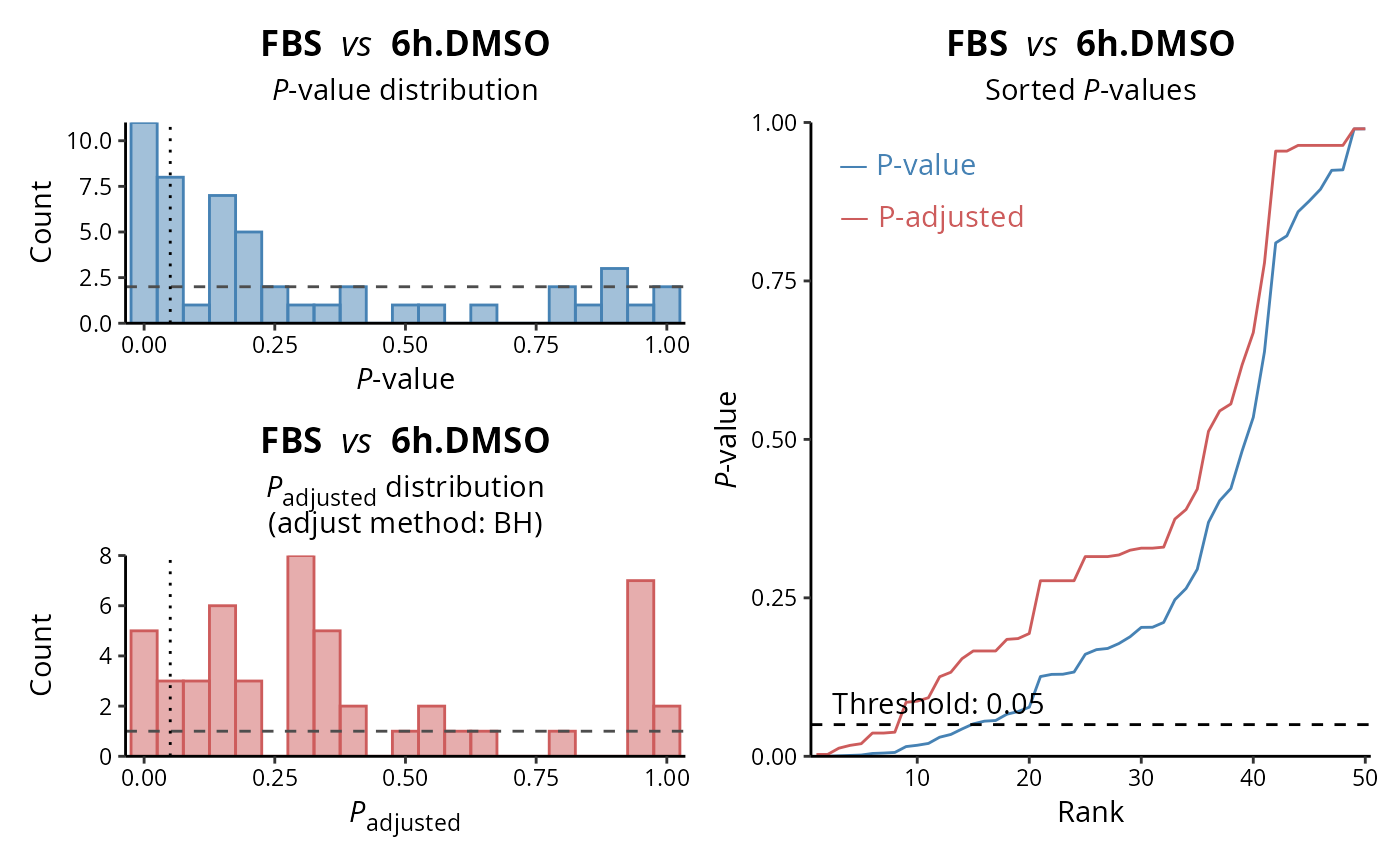
Compares the distributions of the P-values and corresponding adjusted P-values.
check.pvalues(
  DEprot.analyses.object,
  contrast = 1,
  histogram.binwidth = 0.05,
  p.value.color = "steelblue",
  p.adjusted.color = "indianred"
)
Arguments
- DEprot.analyses.object
An object of class
DEprot.analyses(if generated using prolfqua, an error is returned).- contrast
Number indicating the position of the contrast to use for the plotting. Default:
1.- histogram.binwidth
Numeric value indicating. Default:
0.05- p.value.color
String indicating the color to use for the p-values. Default:
"steelblue".- p.adjusted.color
String indicating the color to use for the p-values adjusted. Default:
"indianred".
Value
A DEprot.pvalues object containing 3 slots: distribution histogram of p-values and p-values adjusted and, line plot of ranked p-values.
Examples
pvals <- check.pvalues(DEprot::test.toolbox$diff.exp.limma, contrast = 1)
pvals