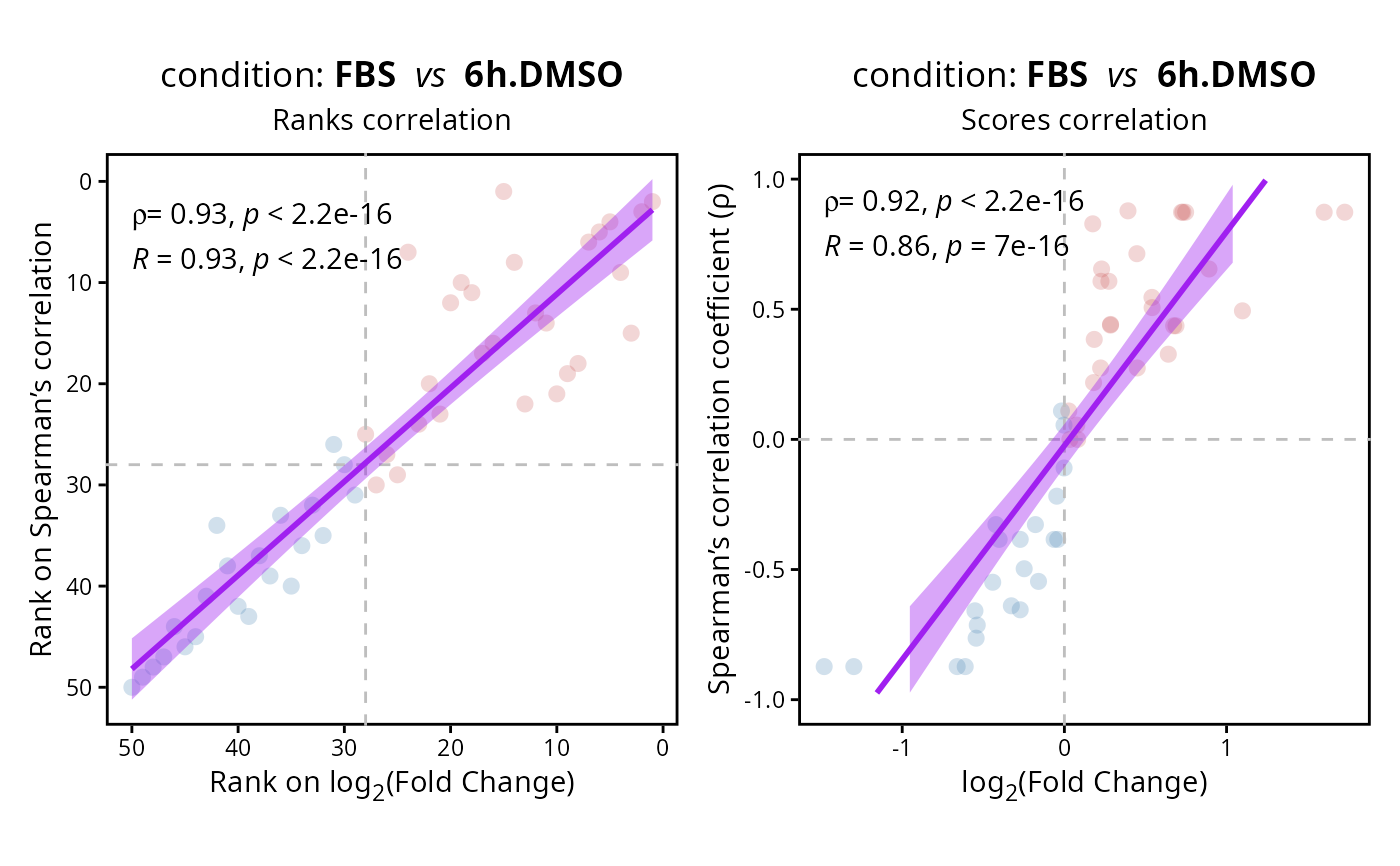
Compare the two possible methods for the gene ranking used to perform Gene Set Enrichment Analyses (GSEA).
# S3 method for class 'ranking'
compare(
  DEprot.analyses.object,
  contrast,
  color.up = "indianred",
  color.down = "steelblue",
  regression.line.color = "purple"
)
Arguments
- DEprot.analyses.object
An object of class
DEprot.analyses.- contrast
Number indicating the position of the contrast to use for the plotting.
- color.up
String indicating any R-supported color that will be used for dots with a positive fold change. Default:
"indianred".- color.down
String indicating any R-supported color that will be used for dots with a negative fold change. Default:
"steelblue".- regression.line.color
String indicating any R-supported color to use for the regression line and error. Default:
"purple".
Value
Two ggplots combined in an object of class patchwork.
Examples
ranking <- compare.ranking(DEprot::test.toolbox$diff.exp.limma, contrast = 1)
ranking
#> Warning: Removed 20 rows containing missing values or values outside the scale range
#> (`geom_smooth()`).