Plots an heatmap of the counts (raw, normalized, randomized or imputed) using ComplexHeatmap. It works like heatmap.counts, but any column of the metadata table can be used to annotate the samples (heatmap columns) and any column of the protein.info table to annotate the proteins (heatmap rows). The colors of the annotations are defined as in pheatmap, through a named list of named vectors. It is possible to perform a scaling (z-score) by row or by column.
heatmap.counts.anno(
  DEprot.object,
  which.data = "imputed",
  contrast = NULL,
  top.n = NULL,
  sample.subset = NULL,
  protein.subset = NULL,
  group.by.metadata.column = NULL,
  column.annotation = NULL,
  row.annotation = NULL,
  annotation.colors = NULL,
  annotation.na.color = "white",
  column.annotation.side = "top",
  row.annotation.side = "left",
  show.annotation.legend = TRUE,
  column.split = NULL,
  row.split = NULL,
  scale = NULL,
  clust.rows = TRUE,
  clust.columns = TRUE,
  distance.method = "euclidean",
  clustering.method = "complete",
  palette = RColorBrewer::brewer.pal(n = 9, name = "Blues"),
  high.color = "firebrick",
  low.color = "#2166AC",
  mid.color = "white",
  na.color = "gray",
  color.limits = c(NA, NA),
  cell.border.color = NA,
  cell.border.width = 0.5,
  heatmap.border = TRUE,
  show.protein.names = FALSE,
  show.sample.names = TRUE,
  protein.names.pattern = NULL,
  title = NULL,
  legend.title = NULL,
  use.raster = NULL,
  use.uncorrected.pvalue = FALSE
)
Arguments
- DEprot.object
An object of class
DEprotorDEprot.analyses.- which.data
String indicating which type of counts should be used. One among: 'raw', 'normalized', 'norm', 'randomized', 'random', 'imputed', 'imp'. Default:
"imputed".- contrast
Numeric vector indicating the position of the contrast to use for the plotting. Only differential proteins in this contrast will be shown. Option available only for an object of class
DEprot.analyses. Default:NULL(non differential protein selection).- top.n
Numeric value indicated the top differentially expressed proteins to consider for the contrast selected. The rank is based on the product of log2Fc and -log10Padj. Option available only for an object of class
DEprot.analyses. Default:NULL(all differential proteins of that contrast).- sample.subset
Character vector indicating a subset of samples to display. The identifiers must correspond to a IDs in the
column.idcolumn of the object's metadata. The samples are displayed in the order provided when the columns are not clustered. Default:NULL(all samples are shown).- protein.subset
Character vector indicating a subset of proteins to display. The identifiers must correspond to the full row.names of the counts table (equivalent to the
prot.idcolumn of the fold change table ofDEprot.analysesobject). This options is can be used in combination withcontrastandtop.n. Default:NULL(all proteins are shown).- group.by.metadata.column
String indicating a column from the metadata table. This column will be used to define sample groups, and for each group it will be computed a mean of the counts. Default:
NULL(no groups).- column.annotation
Character vector indicating one or more columns of the metadata table to use as annotation of the heatmap columns (samples). When the counts are averaged by group (
group.by.metadata.column) only the columns taking a single value in each group can be displayed, the others are dropped with a warning. Default:NULL(no column annotation).- row.annotation
Character vector indicating one or more columns of the
protein.infotable to use as annotation of the heatmap rows (proteins). An annotation table can be attached to the object with add.protein.info. Default:NULL(no row annotation).- annotation.colors
Named list of colors used for the annotations, in the same format used by
pheatmap: one element per annotation column, named as the column itself. Discrete annotations require a named vector of colors (one color per value), while continuous ones accept either a vector of colors, used to build a gradient, or directly a color function such as the ones generated bycirclize::colorRamp2. Columns that are not listed get an automatic palette. Default:NULL(automatic colors).- annotation.na.color
String indicating the color to use for the NA values in the annotations. Default:
"white".- column.annotation.side
String indicating on which side of the heatmap the column annotation should be drawn: "top" or "bottom". Default:
"top".- row.annotation.side
String indicating on which side of the heatmap the row annotation should be drawn: "left" or "right". Default:
"left".- show.annotation.legend
Logical value indicating whether the legends of the annotations should be displayed. Default:
TRUE.- column.split
Either a string indicating a column of the metadata table, used to split the samples in separated blocks, or a numeric value indicating the number of blocks in which the column dendrogram should be cut. Default:
NULL(no splitting).- row.split
Either a string indicating a column of the
protein.infotable, used to split the proteins in separated blocks, or a numeric value indicating the number of blocks in which the row dendrogram should be cut. Default:NULL(no splitting).- scale
String indicating whether Z-scores should be computed. Possible choices: "row" or "column". Default:
NULL(no scaling).- clust.rows
Logical value indicating whether heatmap rows (proteins) should be clustered. Default:
TRUE.- clust.columns
Logical value indicating whether heatmap columns (samples or groups) should be clustered. Default:
TRUE.- distance.method
The distance measure to be used. This must be one of "euclidean", "maximum", "manhattan", "canberra", "binary" or "minkowski". Any unambiguous substring can be given. Default:
"euclidean".- clustering.method
The agglomeration method to be used. This should be (an unambiguous abbreviation of) one of "ward.D", "ward.D2", "single", "complete", "average" (UPGMA), "mcquitty" (WPGMA), "median" (WPGMC) or "centroid" (UPGMC). Default:
"complete".- palette
List of colors to use for the color gradient of the heatmap. This parameters is used when raw-counts are plotted. For scaled data see the high, low and mid parameters. Default:
RColorBrewer\:\:brewer.pal(n = 9, name = "Blues").- high.color
String indicating the color to use for positive Z-score for scaled data. Default:
"indianred".- low.color
String indicating the color to use for negative Z-score for scaled data. Default:
"\#2166AC"(blue).- mid.color
String indicating the color to use for the 0 Z-score value for scaled data. Default:
"white".- na.color
String indicating the color to use for the NA values in the heatmap. Default:
"gray".- color.limits
Numeric vector of length 2 indicating lower and upper limit of the color scale values. Default:
c(NA,NA), automatic limits applied.- cell.border.color
String indicating the color to use for the individual cells border. Default:
NA(no border).- cell.border.width
Numeric value indicating the width of the cell border line. Ignored when
cell.border.color = NA. Default:0.5.- heatmap.border
Logical value indicating whether a black border should be drawn around the heatmap body. Default:
TRUE.- show.protein.names
Logical value to indicate whether the protein names should be displayed. Default:
FALSE.- show.sample.names
Logical value to indicate whether the sample (or group) names should be displayed. Default:
TRUE.- protein.names.pattern
Character indicating a regular expression to remove from the protein IDs. Default:
NULL, no alterations in the protein IDs.- title
String indicating the title to use. Markdown formatting is not supported by
ComplexHeatmap. Default:NULL(no title).- legend.title
String indicating the title of the heatmap color legend. Default:
NULL(automatic title).- use.raster
Logical value indicating whether the heatmap body should be rasterized, which keeps the size of the output reasonable when thousands of proteins are plotted. Default:
NULL, rasterization applied when more than 2000 rows are displayed.- use.uncorrected.pvalue
Logical value indicating whether it should be used the normal p-value instead of the adjusted one (differential proteins numbers are recomputed). Default:
FALSE, padj is used.
Value
A DEprot.counts.heatmap object, which contains the ComplexHeatmap heatmap and the hclust objects used to order rows and columns.
Details
The heatmap is returned unevaluated: rows and columns are ordered by ComplexHeatmap at drawing time. Any further customization can be applied on the heatmap slot of the object using the standard ComplexHeatmap syntax, for instance to concatenate more heatmaps or annotations. When the heatmap is split by a column of the metadata (or of the protein.info), the clustering is recomputed within each block, while the hclust objects stored in the returned object are always computed on the full matrix.
See also
Examples
# \donttest{
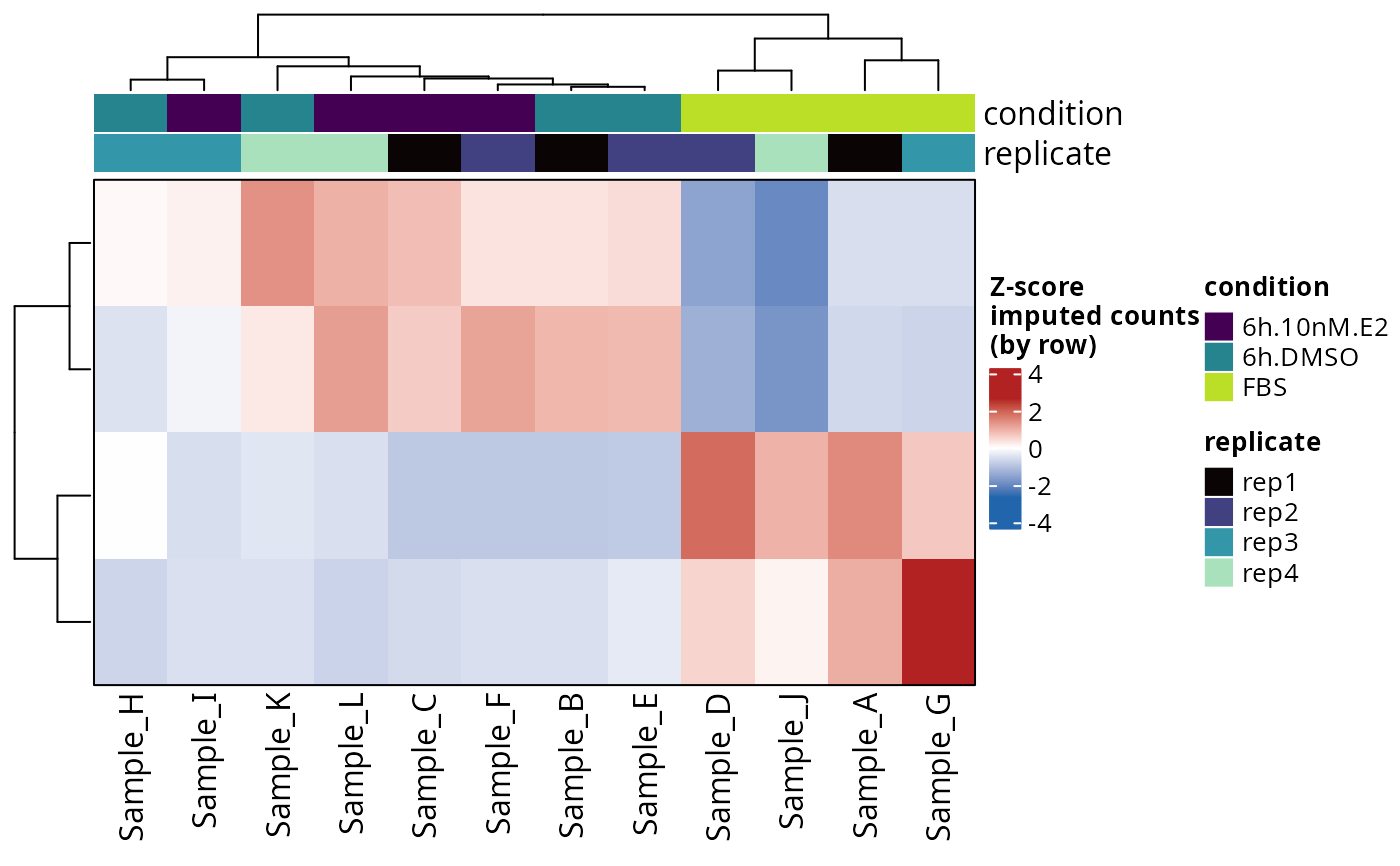
# Top differential proteins, samples annotated by condition and replicate
heatmap.counts.anno(DEprot.object = DEprot::test.toolbox$diff.exp.limma,
contrast = 1,
top.n = 20,
scale = "row",
column.annotation = c("condition", "replicate"))
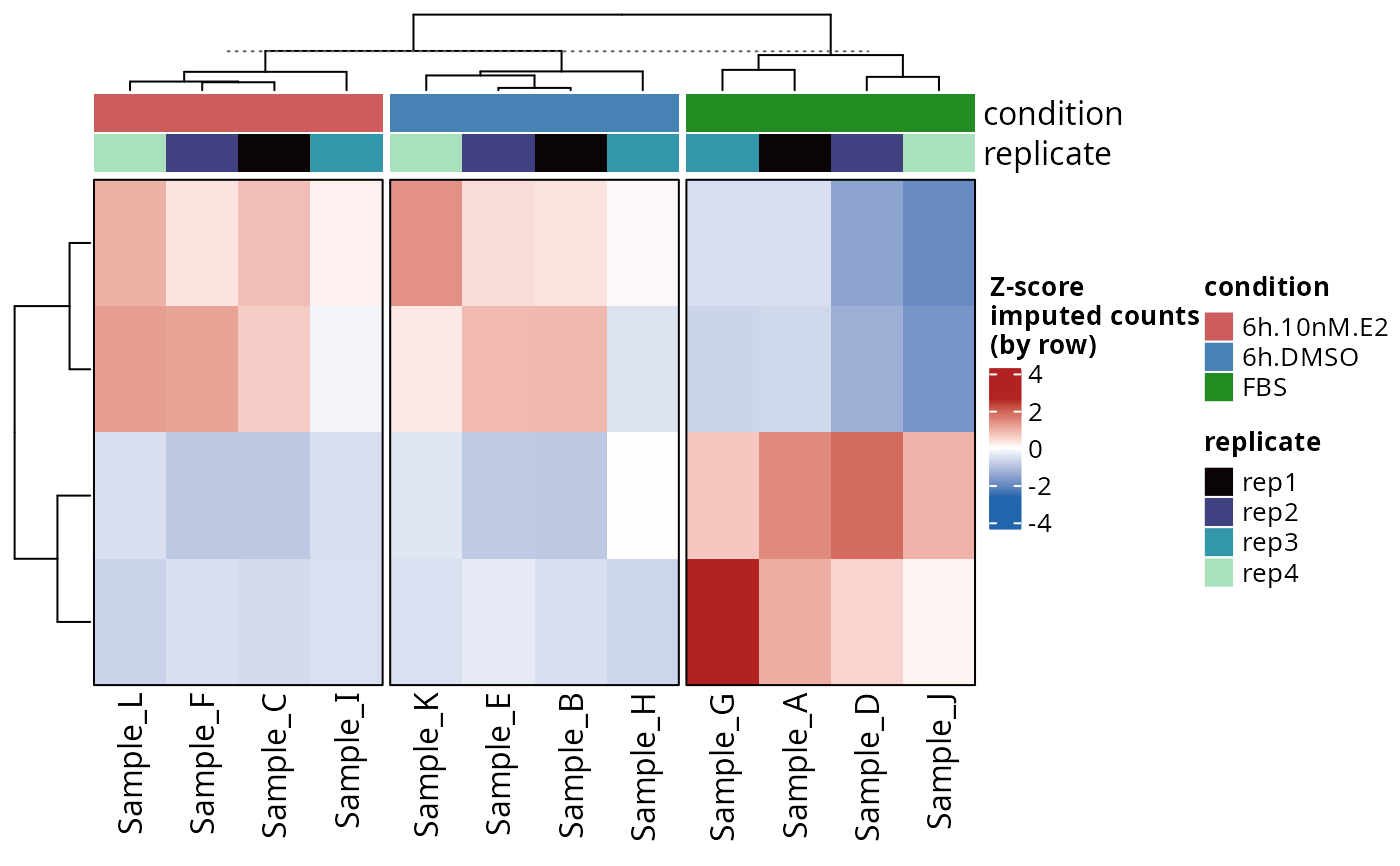
 # Same heatmap with custom colors and samples split by condition
heatmap.counts.anno(DEprot.object = DEprot::test.toolbox$diff.exp.limma,
contrast = 1,
top.n = 20,
scale = "row",
column.annotation = c("condition", "replicate"),
column.split = "condition",
annotation.colors = list(condition = c("6h.10nM.E2" = "indianred",
"6h.DMSO" = "steelblue",
"FBS" = "forestgreen")))
# Same heatmap with custom colors and samples split by condition
heatmap.counts.anno(DEprot.object = DEprot::test.toolbox$diff.exp.limma,
contrast = 1,
top.n = 20,
scale = "row",
column.annotation = c("condition", "replicate"),
column.split = "condition",
annotation.colors = list(condition = c("6h.10nM.E2" = "indianred",
"6h.DMSO" = "steelblue",
"FBS" = "forestgreen")))
 # }
# }