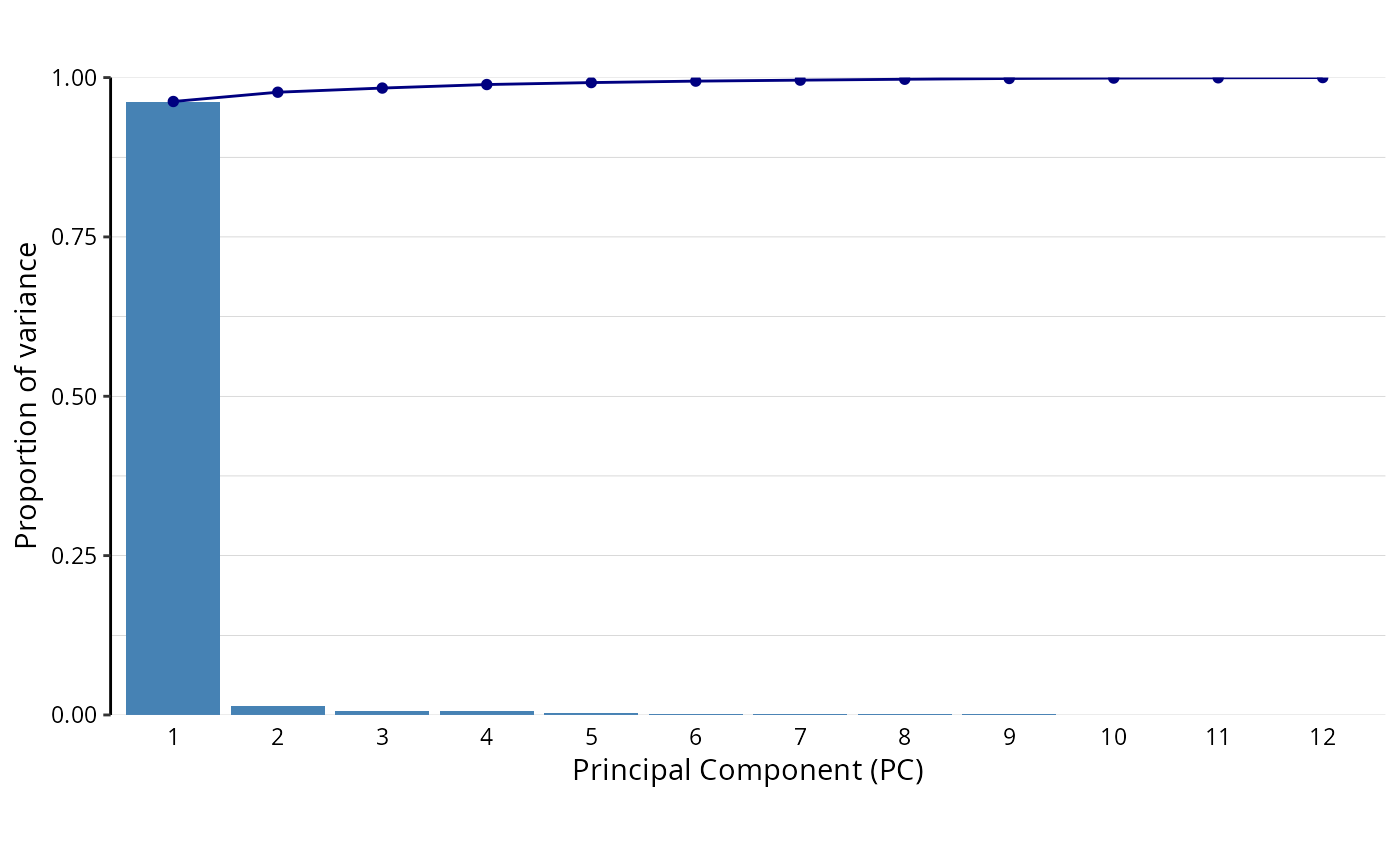
Function to plot the cumulative variance of all the principal components of a PCA.
# S3 method for class 'PC.cumulative'
plot(
  DEprot.PCA.object,
  bar.color = "steelblue",
  line.color = "navyblue",
  title = NULL
)
Arguments
- DEprot.PCA.object
An object of class
DEprot.PCA.- bar.color
String indicating the color to use for the bar fill. Default:
"steelblue".- line.color
String indicating the color to use for the line and the dots of the cumulative curve. Default:
"navyblue".- title
String indicating the title of the plot (markdown annotation supported).
Value
A barplot in ggplot format.
Examples
# Perform Principal Component Analyses (PCA)
pca <- perform.PCA(DEprot.object = DEprot::test.toolbox$dpo.imp)

# Plot cumulative variance barplot
plot.PC.cumulative(pca)