Plot a scatter of the PCs from an object generated by perform.PCA.
# S3 method for class 'PC.scatter'
plot(
  DEprot.PCA.object,
  PC.x = 2,
  PC.y = 1,
  color.column = "column.id",
  shape.column = NULL,
  label.column = NULL,
  plot.zero.lines = TRUE
)
Arguments
- DEprot.PCA.object
An object of class
DEprot.PCA.object, as generated by perform.PCA.- PC.x
Number indicating which Principal Component (PC) display on the x-axis. Default:
2(PC2).- PC.y
Number indicating which Principal Component (PC) display on the y-axis. Default:
1(PC1).- color.column
String indicating the name of the column in the
metadatato use as factor for the dot colors. Default:"column.id"(each sample a color).- shape.column
String indicating the name of the column in the
metadatato use as factor for the dot shapes. Default:NULL(all dots).- label.column
String indicating the name of the column in the
metadatato use as label of the dots. Default:NULL(no labeling).- plot.zero.lines
Logical value to indicate whether to plot two gray dashed lines in correspondence of y=0 and x=0. Default:
TRUE.
Value
A ggplot object.
See also
Examples
# Perform Principal Component Analyses (PCA)
pca <- perform.PCA(DEprot.object = DEprot::test.toolbox$dpo.imp)
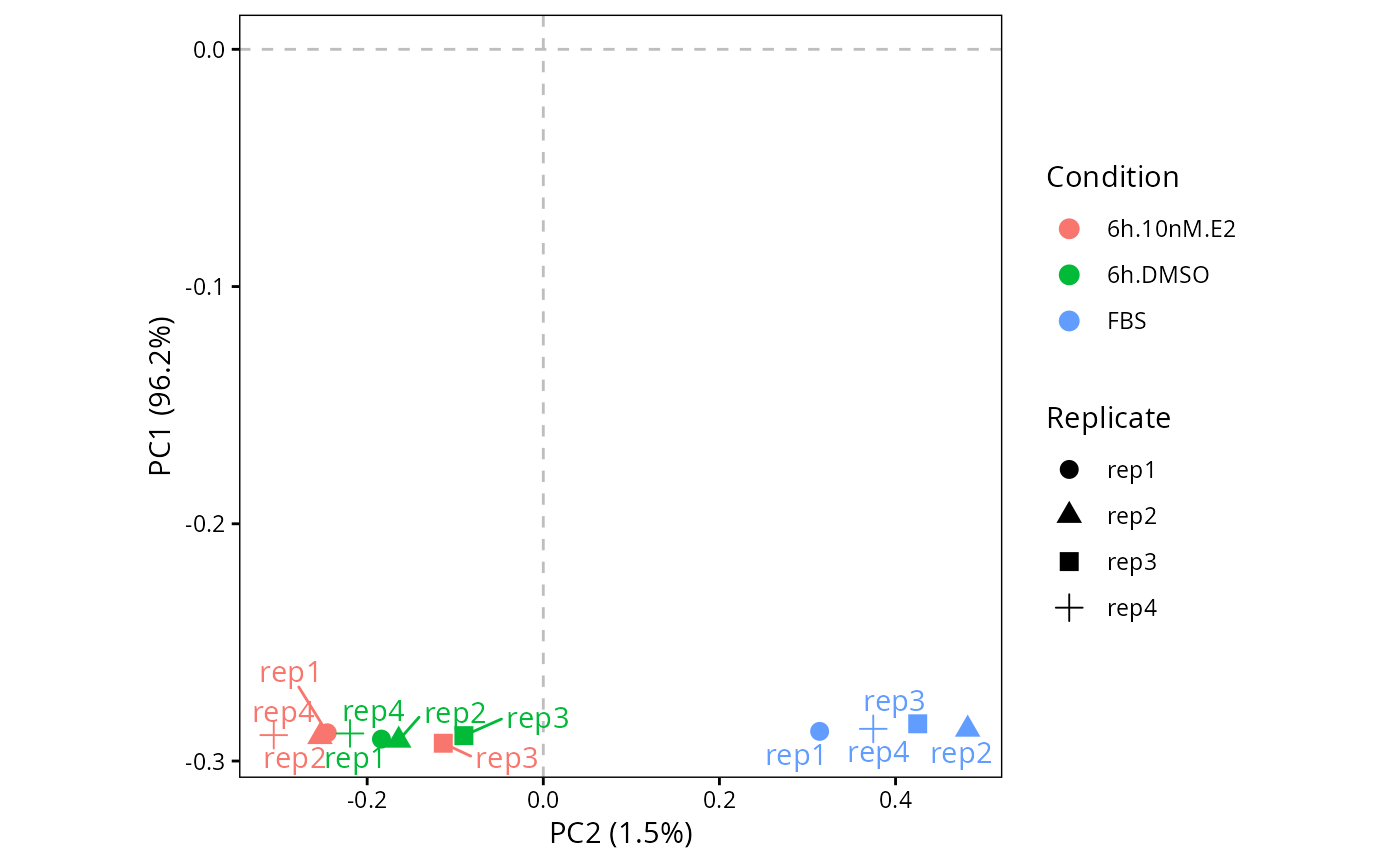
# Plot PC1-vs-PC2 scatter
plot.PC.scatter(DEprot.PCA.object = pca,
color.column = "condition",
shape.column = "replicate",
label.column = "replicate")
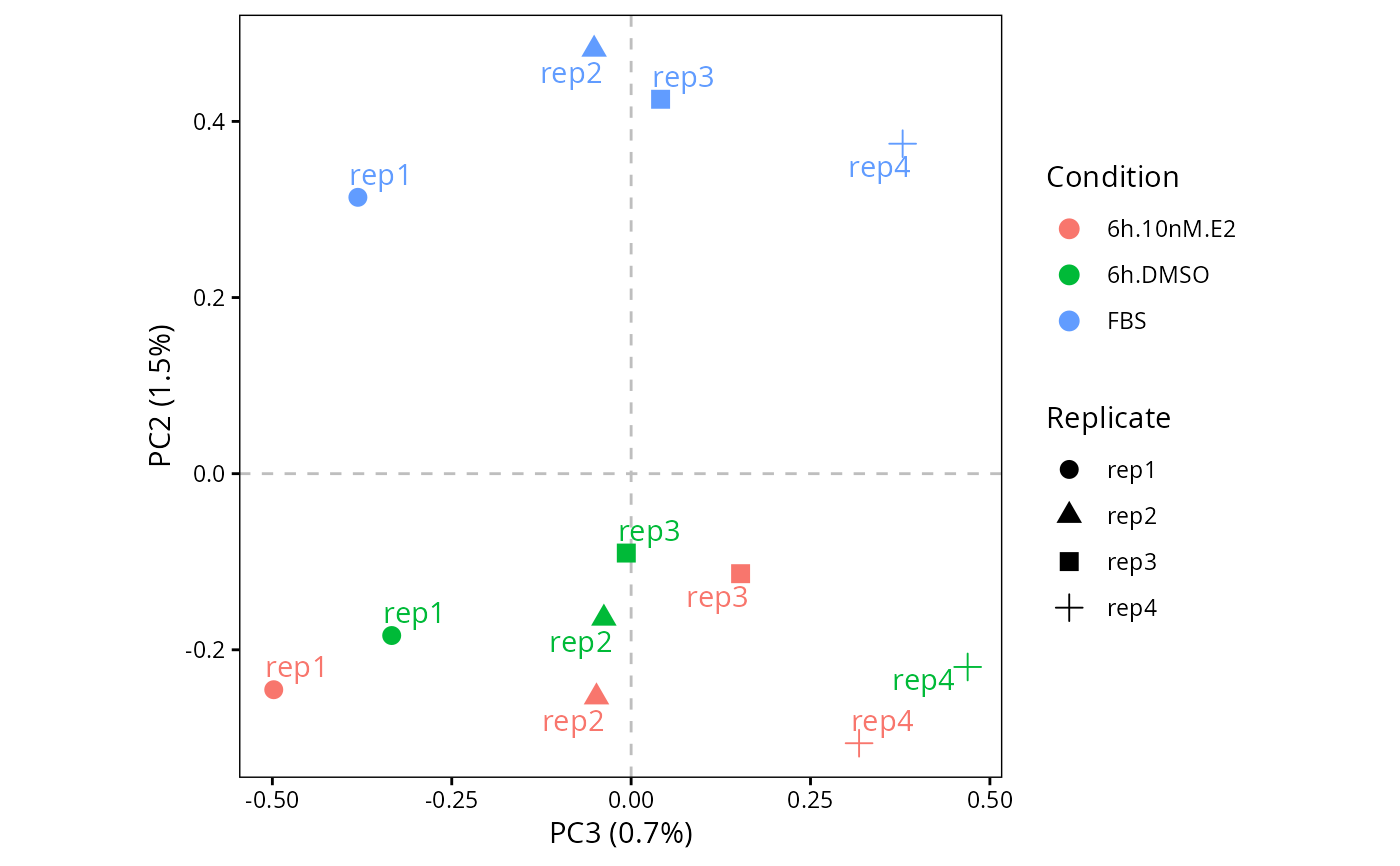
 # Plot PC2-vs-PC3 scatter
plot.PC.scatter(DEprot.PCA.object = pca,
PC.x = 3,
PC.y = 2,
color.column = "condition",
shape.column = "replicate",
label.column = "replicate")
# Plot PC2-vs-PC3 scatter
plot.PC.scatter(DEprot.PCA.object = pca,
PC.x = 3,
PC.y = 2,
color.column = "condition",
shape.column = "replicate",
label.column = "replicate")