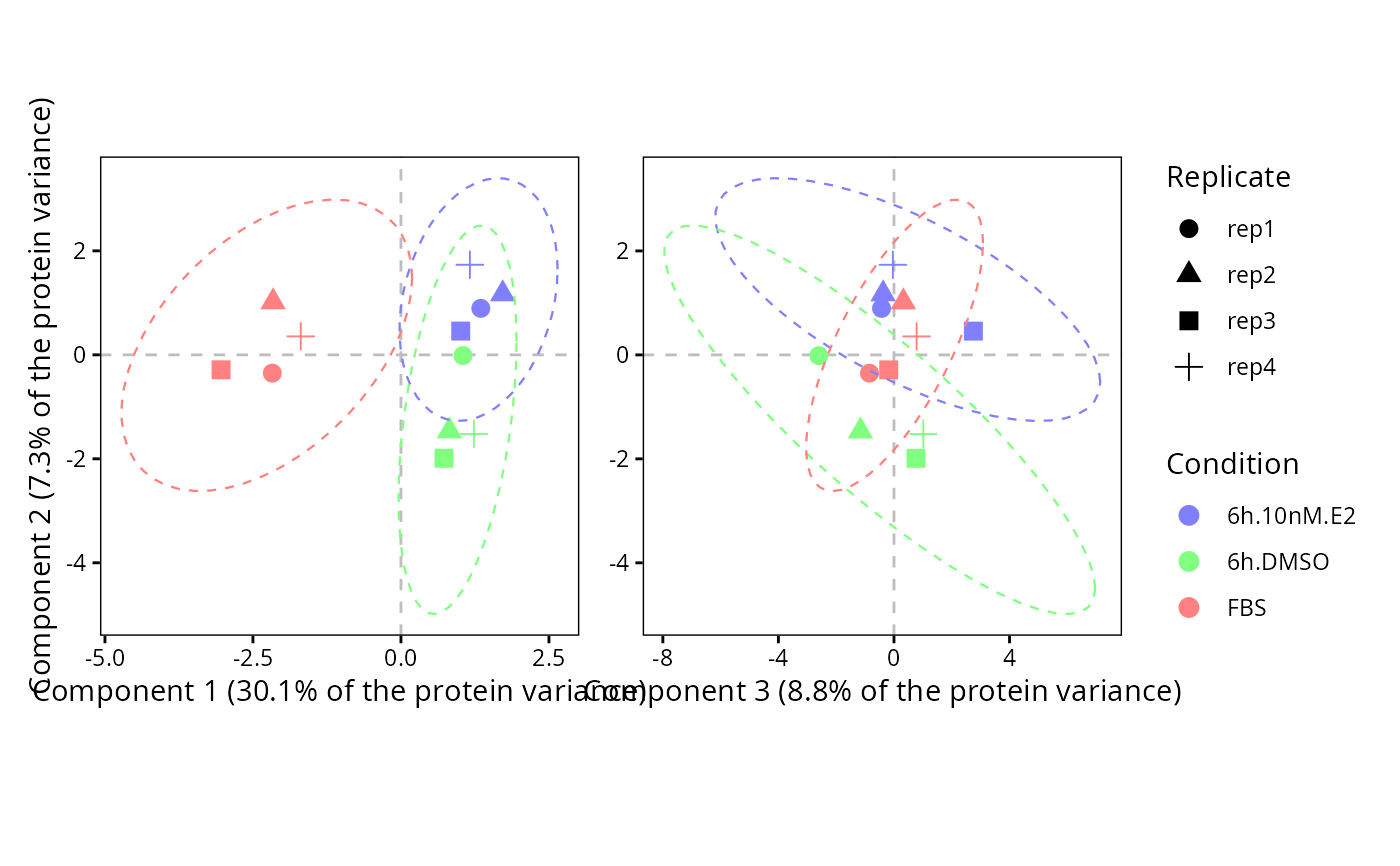
Combines the component1-vs-component2 and component3-vs-component2 scatters of a sPLS-DA.
# S3 method for class 'sPLSDA.scatter.123'
plot(
  DEprot.sPLSDA.object,
  color.column = NULL,
  shape.column = NULL,
  label.column = NULL,
  dot.colors = NULL,
  ellipse = TRUE,
  ellipse.level = 0.95,
  title = NULL
)
Arguments
- DEprot.sPLSDA.object
An object of class
DEprot.sPLSDA.- color.column
String indicating the name of the column in the metadata to use as factor for the dot colors. Default:
NULL(the column used to fit the model).- shape.column
String indicating the name of the column in the metadata to use as factor for the dot shapes. Default:
NULL(all dots).- label.column
String indicating the name of the column in the metadata to use as label of the dots. Default:
NULL(no labeling).- dot.colors
Color-vector to use for the points. Default:
NULL(automatic colors).- ellipse
Logical value indicating whether a confidence ellipse should be drawn around each group. Default:
TRUE.- ellipse.level
Numeric value (0-1) indicating the confidence level of the ellipses. Default:
0.95.- title
String indicating the title of the combined plot (markdown annotation supported). Default:
NULL.
Value
A patchwork object.
See also
Examples
splsda <- perform.sPLSDA(DEprot.object = DEprot::test.toolbox$dpo.imp,
                         group.column = "condition",
                         keepX = 5,
                         validate = FALSE)
#> Warning: The number of 'folds' (5) is larger than the smallest class (4 samples): 'folds' has been set to 4.

plot.sPLSDA.scatter.123(DEprot.sPLSDA.object = splsda,
                        shape.column = "replicate")
#> Warning: The following aesthetics were dropped during statistical transformation: shape.
#> ℹ This can happen when ggplot fails to infer the correct grouping structure in
#>   the data.
#> ℹ Did you forget to specify a `group` aesthetic or to convert a numerical
#>   variable into a factor?
#> Warning: The following aesthetics were dropped during statistical transformation: shape.
#> ℹ This can happen when ggplot fails to infer the correct grouping structure in
#>   the data.
#> ℹ Did you forget to specify a `group` aesthetic or to convert a numerical
#>   variable into a factor?