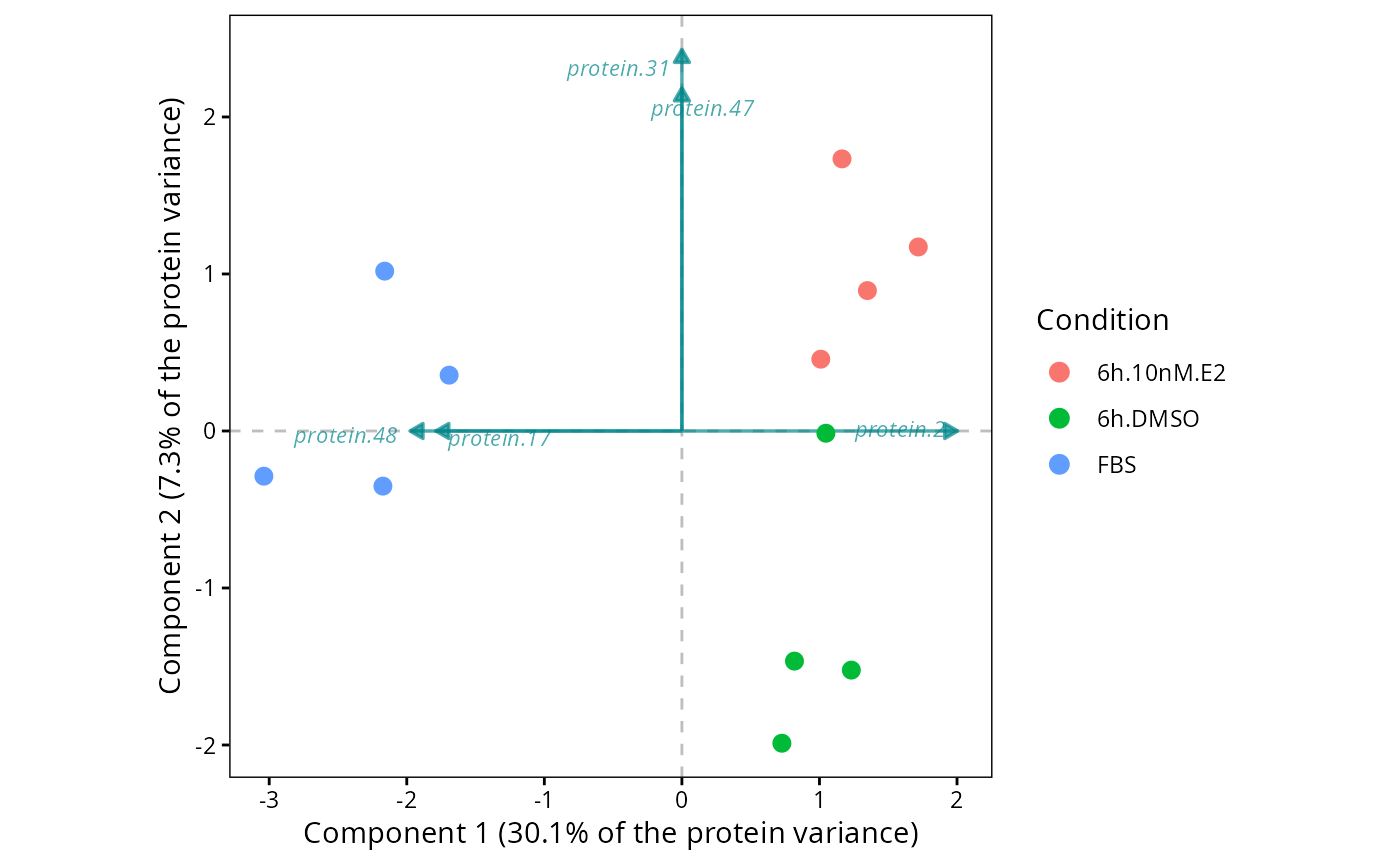
Overlays the loadings of the selected proteins on the scatter of two components of a sPLS-DA.
# S3 method for class 'sPLSDA.biplot'
plot(
  DEprot.sPLSDA.object,
  comp.x = 1,
  comp.y = 2,
  color.column = NULL,
  shape.column = NULL,
  label.column = NULL,
  ellipse = FALSE,
  ellipse.level = 0.95,
  plot.zero.line.x = TRUE,
  plot.zero.line.y = TRUE,
  n.loadings = 10,
  loading.color = "turquoise4",
  loading.arrow.size = 0.6,
  loading.label.size = 3,
  loading.alpha = 0.7,
  loading.scale = 0.8
)
Arguments
- DEprot.sPLSDA.object
An object of class
DEprot.sPLSDA.- comp.x
Number indicating which component to display on the x-axis. Default:
1.- comp.y
Number indicating which component to display on the y-axis. Default:
2.- color.column
String indicating the name of the column in the metadata to use as factor for the dot colors. Default:
NULL(the column used to fit the model).- shape.column
String indicating the name of the column in the metadata to use as factor for the dot shapes. Default:
NULL(all dots).- label.column
String indicating the name of the column in the metadata to use as label of the dots. Default:
NULL(no labeling).- ellipse
Logical value indicating whether a confidence ellipse should be drawn around each group. Default:
FALSE.- ellipse.level
Numeric value (0-1) indicating the confidence level of the ellipses. Default:
0.95.- plot.zero.line.x
Logical value to indicate whether to plot a gray dashed line in correspondence of x=0. Default:
TRUE.- plot.zero.line.y
Logical value to indicate whether to plot a gray dashed line in correspondence of y=0. Default:
TRUE.- n.loadings
Number of proteins to display, ranked by their distance from the origin in the plane displayed. Default:
10.- loading.color
String indicating the color of the arrows and of their labels. Default:
"turquoise4".- loading.arrow.size
Numeric value indicating the linewidth of the arrows. Default:
0.6.- loading.label.size
Numeric value indicating the font size of the labels. Default:
3.- loading.alpha
Numeric value (0-1) indicating the transparency of arrows and labels. Default:
0.7.- loading.scale
Numeric multiplier to manually adjust the length of the arrows. Default:
0.8.
Value
A ggplot object.
Details
Only the proteins retained on at least one of the two components displayed can appear: a protein dropped by the sparsity penalty has a coefficient of exactly zero and no direction to point to.
Examples
splsda <- perform.sPLSDA(DEprot.object = DEprot::test.toolbox$dpo.imp,
                         group.column = "condition",
                         keepX = 5,
                         validate = FALSE)
#> Warning: The number of 'folds' (5) is larger than the smallest class (4 samples): 'folds' has been set to 4.

plot.sPLSDA.biplot(DEprot.sPLSDA.object = splsda,
                   comp.x = 1,
                   comp.y = 2,
                   n.loadings = 5)