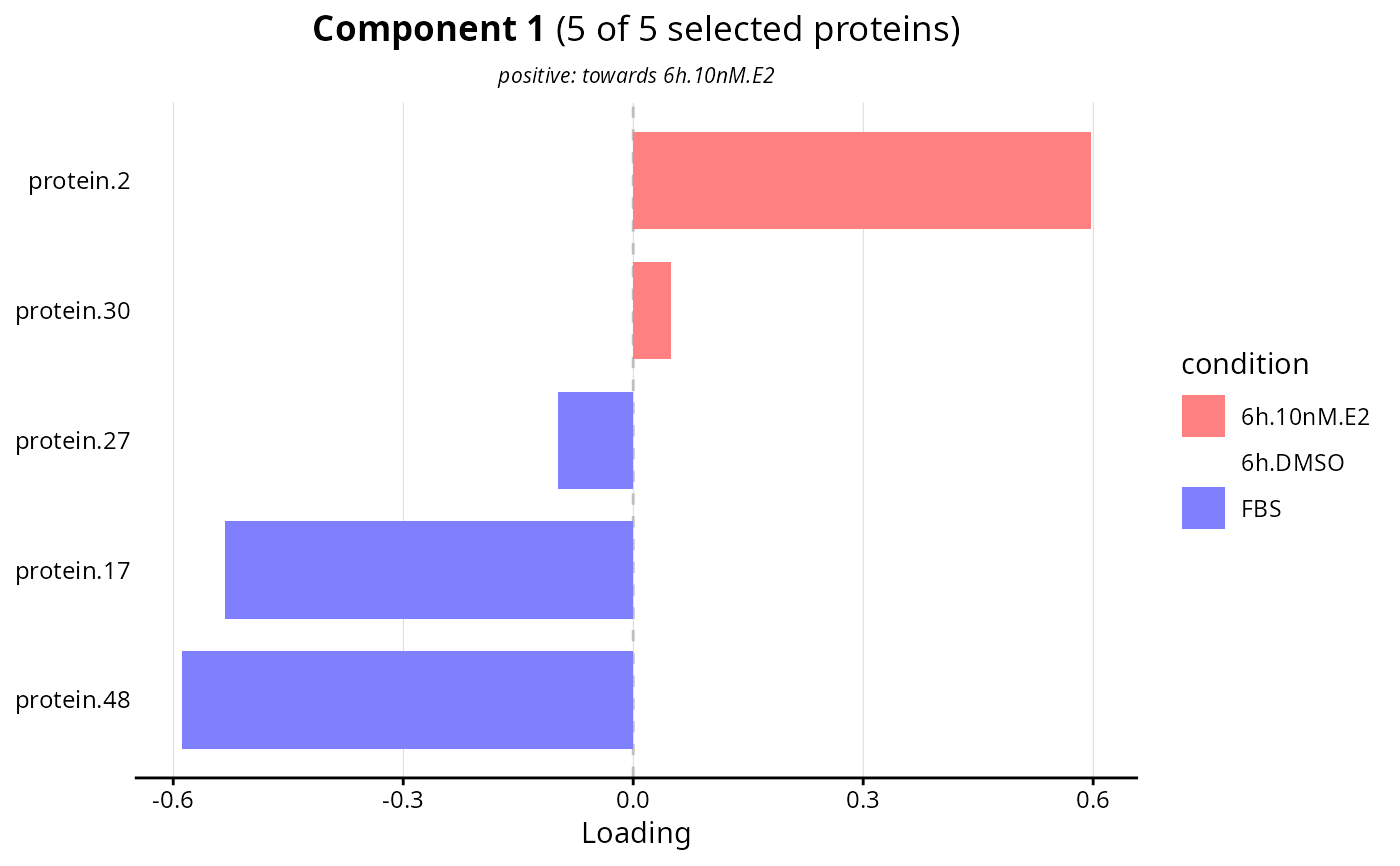
Plots the loadings of the proteins retained on a component of a sPLS-DA, colored by the class in which each of them is the highest.
# S3 method for class 'sPLSDA.loadings'
plot(
  DEprot.sPLSDA.object,
  component = 1,
  n.proteins = 25,
  group.colors = NULL,
  protein.names.pattern = NULL,
  bar.width = 0.75,
  axes.text.size = 9,
  title = NULL
)
Arguments
- DEprot.sPLSDA.object
An object of class
DEprot.sPLSDA.- component
Numeric value indicating the component to display. Default:
1.- n.proteins
Numeric value indicating the maximum number of proteins to display, ranked by absolute loading. Default:
25.- group.colors
Color-vector (optionally named on the classes) used for the bars. Default:
NULL(automatic colors).- protein.names.pattern
String indicating a pattern to be passed to gsub and removed from the protein names. Default:
NULL(no changes).- bar.width
Numeric value indicating the width of the bars. Default:
0.75.- axes.text.size
Numeric value indicating the font size of the axis text. Default:
9.- title
String indicating the title of the plot (markdown annotation supported). Default:
NULL(automatic title).
Value
A ggplot object.
Details
The sign of a loading is only interpretable once the orientation of the component is fixed, which perform.sPLSDA does through the reference.group argument: a positive coefficient marks a protein pulling the samples towards that group. The color adds the information the coefficient alone does not carry, namely in which class the protein is actually the most abundant, assigned by the highest median as done by mixOmics::plotLoadings.
Examples
splsda <- perform.sPLSDA(DEprot.object = DEprot::test.toolbox$dpo.imp,
                         group.column = "condition",
                         keepX = 5,
                         validate = FALSE)
#> Warning: The number of 'folds' (5) is larger than the smallest class (4 samples): 'folds' has been set to 4.

plot.sPLSDA.loadings(DEprot.sPLSDA.object = splsda,
                     component = 1,
                     n.proteins = 5)