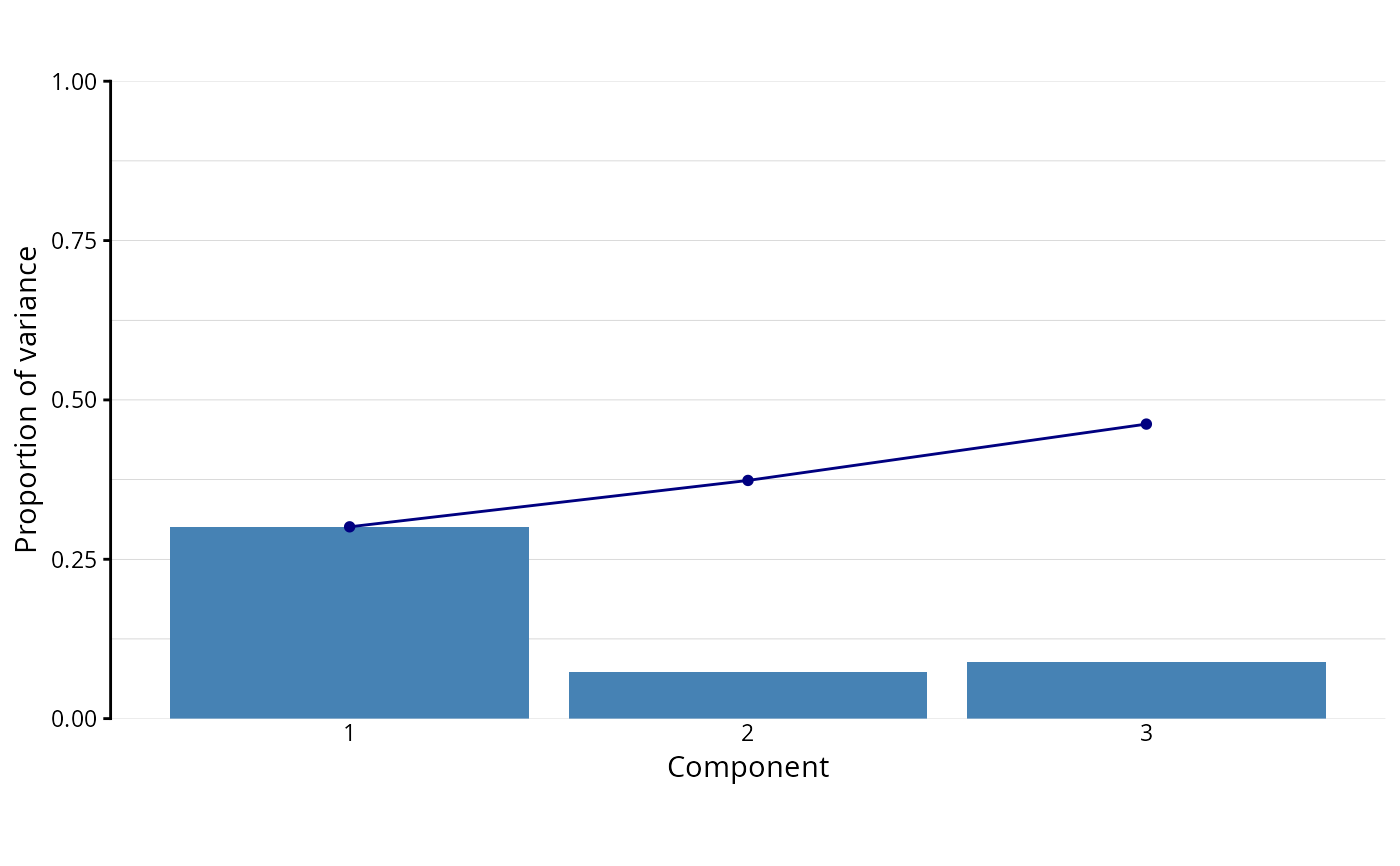
Plots the proportion of protein variance carried by each component of a sPLS-DA, with the cumulative curve on top.
# S3 method for class 'sPLSDA.cumulative'
plot(
  DEprot.sPLSDA.object,
  bar.color = "steelblue",
  line.color = "navyblue",
  title = NULL
)
Arguments
- DEprot.sPLSDA.object
An object of class
DEprot.sPLSDA.- bar.color
String indicating the color to use for the bar fill. Default:
"steelblue".- line.color
String indicating the color to use for the line and the dots of the cumulative curve. Default:
"navyblue".- title
String indicating the title of the plot (markdown annotation supported). Default:
NULL.
Value
A ggplot object.
Details
A sPLS-DA component is built to separate the classes, not to capture variance, and it only sees the handful of proteins retained by keepX. The percentages are therefore much lower than the ones of a PCA computed on the same data, and comparing the two is meaningless: what this plot shows is how the (little) variance used by the model is spread over the components.
See also
Examples
splsda <- perform.sPLSDA(DEprot.object = DEprot::test.toolbox$dpo.imp,
                         group.column = "condition",
                         keepX = 5,
                         validate = FALSE)
#> Warning: The number of 'folds' (5) is larger than the smallest class (4 samples): 'folds' has been set to 4.

plot.sPLSDA.cumulative(DEprot.sPLSDA.object = splsda)