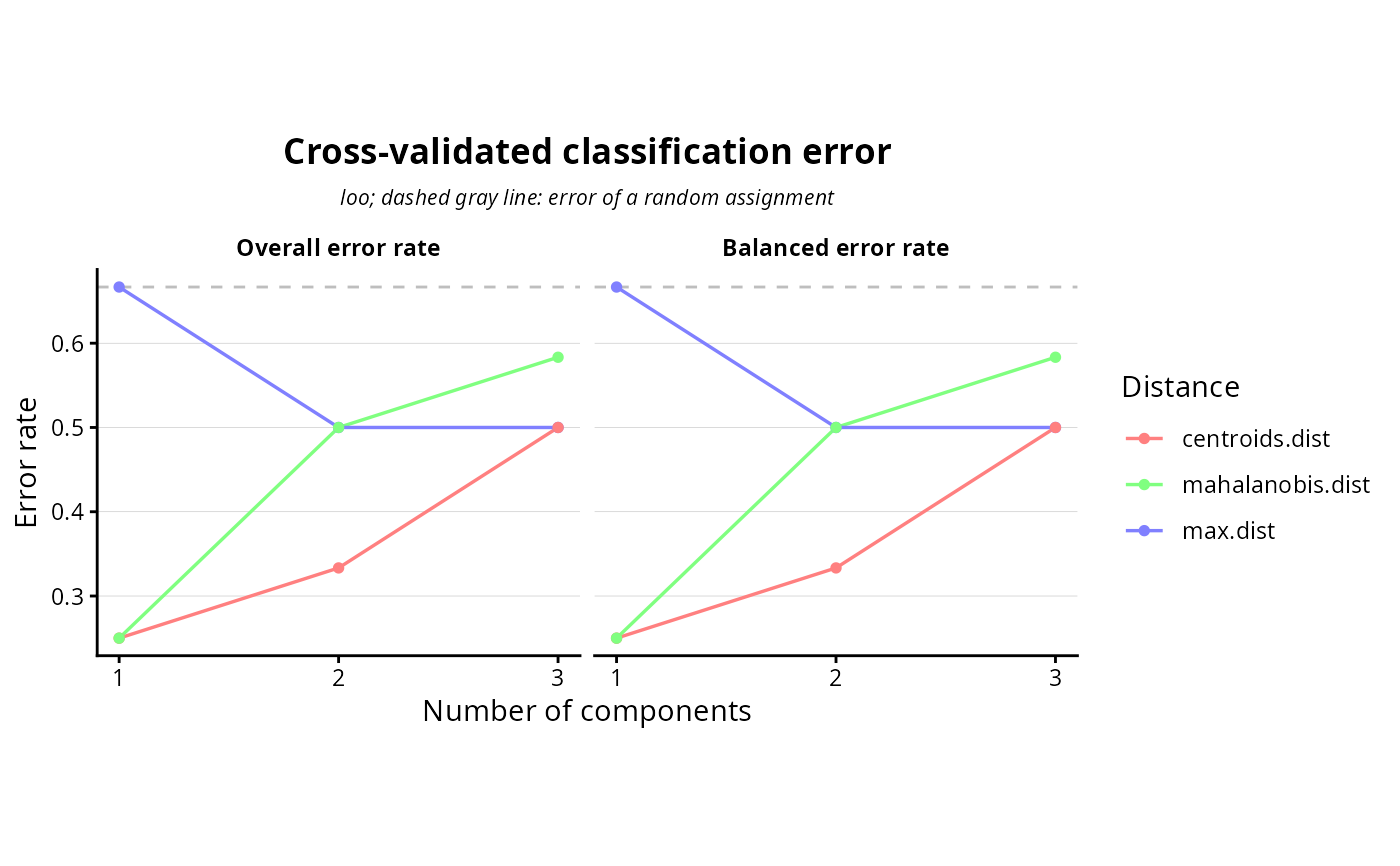
Plots the cross-validated classification error of a sPLS-DA as a function of the number of components.
# S3 method for class 'sPLSDA.performance'
plot(
  DEprot.sPLSDA.object,
  metric = "both",
  distance = "all",
  line.colors = NULL,
  title = "**Cross-validated classification error**"
)
Arguments
- DEprot.sPLSDA.object
An object of class
DEprot.sPLSDA.- metric
String indicating which error to display. One among: 'both', 'overall', 'BER' (balanced error rate). Default:
"both".- distance
String indicating the prediction distance(s) to display. One among: 'all', 'max.dist', 'centroids.dist', 'mahalanobis.dist'. Default:
"all".- line.colors
Color-vector used for the distances. Default:
NULL(automatic colors).- title
String indicating the title of the plot (markdown annotation supported). Default:
"**Cross-validated classification error**".
Value
A ggplot object.
Details
The balanced error rate is the average of the error rates of each class, and it is the value to read on an unbalanced design: with 9 samples in one group and 3 in the other, a model that assigns everything to the larger group already reaches an overall error of 25
The dashed gray line marks the error of a random assignment, that is one minus the frequency of the largest class. A model sitting on that line is not discriminating anything, however clean its scatter plot looks.
See also
Examples
# \donttest{
# the performances are estimated by resampling the samples: with 12 samples in 3 groups
# the leave-one-out scheme is the only one leaving enough samples in each fold
splsda <- perform.sPLSDA(DEprot.object = DEprot::test.toolbox$dpo.imp,
group.column = "condition",
keepX = 5,
validate = TRUE,
validation = "loo")
#> Estimating the classification performances by cross-validation...
plot.sPLSDA.performance(DEprot.sPLSDA.object = splsda)
 # }
# }