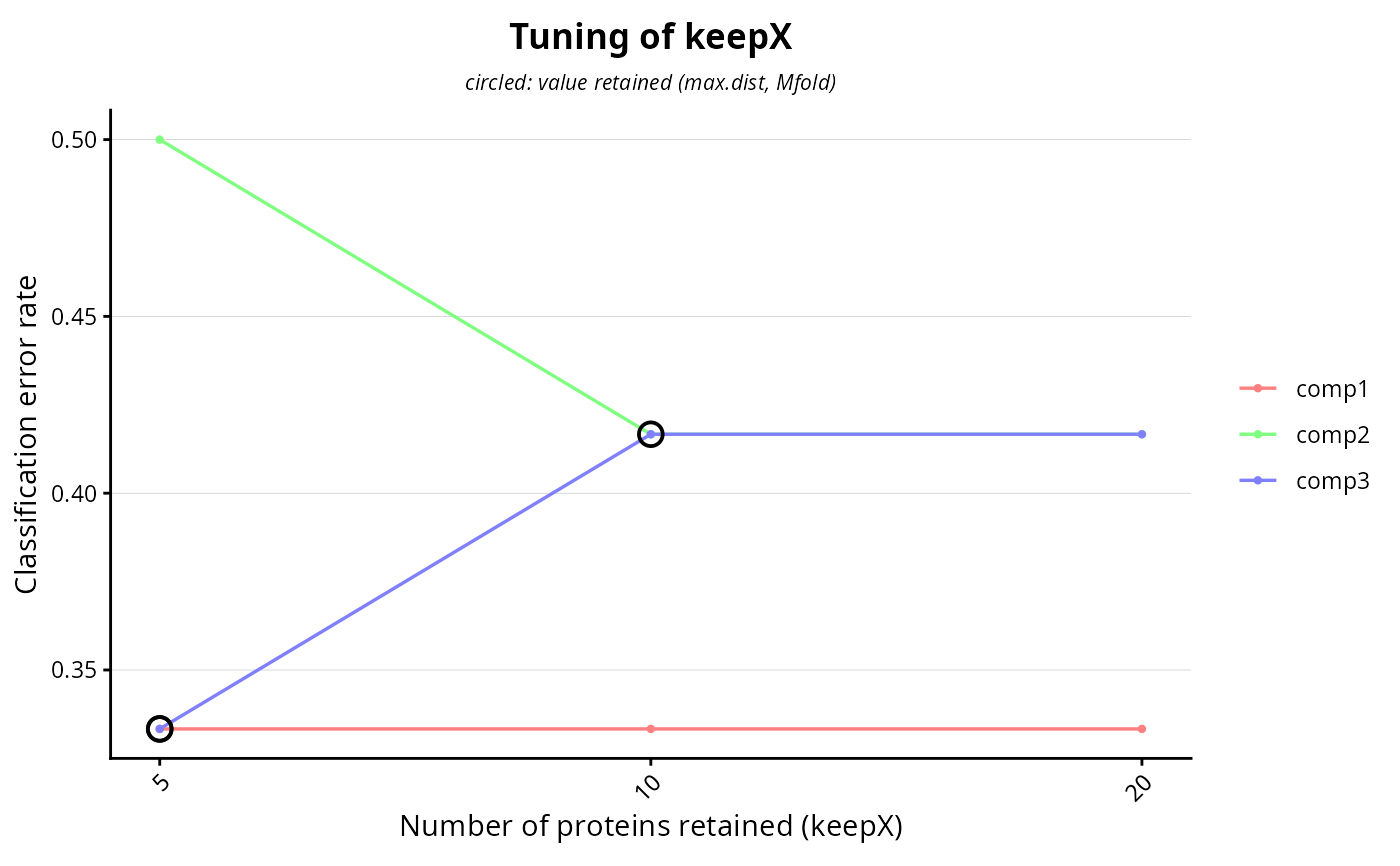
Plots the classification error obtained over the grid of keepX values tested during the tuning of a sPLS-DA, and marks the value retained on each component.
# S3 method for class 'sPLSDA.tuning'
plot(
  DEprot.sPLSDA.object,
  component = NULL,
  line.colors = NULL,
  show.sd = TRUE,
  title = "**Tuning of keepX**"
)
Arguments
- DEprot.sPLSDA.object
An object of class
DEprot.sPLSDA.- component
Numeric value (or vector) indicating the component(s) to display. Default:
NULL(all the components).- line.colors
Color-vector used for the components. Default:
NULL(automatic colors).- show.sd
Logical value indicating whether the standard deviation over the repeats should be drawn as a ribbon. Default:
TRUE.- title
String indicating the title of the plot (markdown annotation supported). Default:
"**Tuning of keepX**".
Value
A ggplot object.
Details
The curves are usually flat over a wide range of values: many different numbers of proteins classify the samples equally well, and the minimum picked by the tuning is one point of a plateau rather than an optimum. Reading the plot is worth the time, because a value sitting at the left edge of that plateau gives a shorter and more interpretable protein list at no cost in error rate.
See also
Examples
# \donttest{
# the tuning runs only when 'keepX' is left to NULL
splsda <- perform.sPLSDA(DEprot.object = DEprot::test.toolbox$dpo.imp,
group.column = "condition",
test.keepX = c(5, 10, 20),
validate = FALSE,
folds = 3,
nrepeat = 1)
#> Tuning 'keepX' by cross-validation over 3 values...
#> Note that the number of components cannot be reliably tuned with nrepeat < 3 or validaion = 'loo'.
plot.sPLSDA.tuning(DEprot.sPLSDA.object = splsda)
 # }
# }