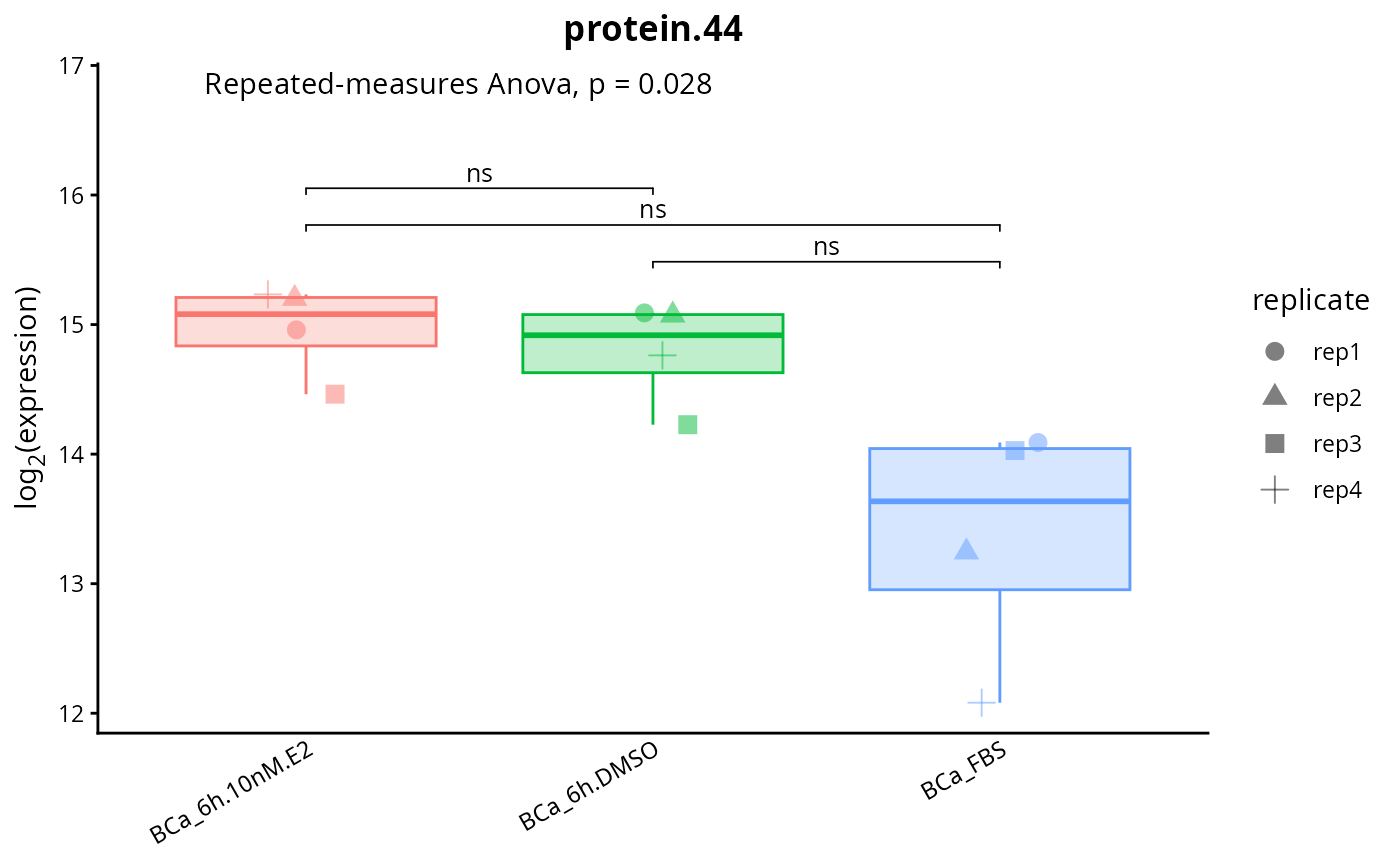
Plots a boxplot of the expression of one or more proteins. Samples can be grouped depending on a metadata column. Optionally, the p-values of all the pairwise (2-by-2) comparisons between groups can be added on top of the plot.
expression.boxplot(
  DEprot.object,
  protein.id,
  which.data = "imputed",
  sample.subset = NULL,
  shape.column = NULL,
  group.by.metadata.column = "column.id",
  group.levels = NULL,
  scale.expression = FALSE,
  x.label.angle = 30,
  ncol = NULL,
  free.y = TRUE,
  pairwise.comparisons = FALSE,
  pairwise.test.type = "wilcox.test",
  pairwise.include.ns = TRUE,
  pairwise.p.label = "p.signif",
  pairwise.p.decimals = 2,
  paired.test = FALSE,
  replicate.column = NULL
)
Arguments
- DEprot.object
An object of class
DEprotorDEprot.analyses.- protein.id
String (or vector of strings) indicating the protein(s) for which plot the expression. The identifiers must correspond to the full row.names of the counts table (equivalent to the
prot.idcolumn of the fold change table ofDEprot.analysesobject). When several proteins are provided the plot is faceted, one panel per protein.- which.data
String indicating which type of counts should be used. One among: 'raw', 'normalized', 'norm', 'imputed', 'randomized', 'random', 'imp'. Default:
"imputed".- sample.subset
Character vector indicating a subset of samples to display. The identifiers must correspond to a IDs in the
column.idcolumn of the object's metadata. Default:NULL(all samples are shown).- shape.column
String indicating a column from the metadata table. This column will be used as factor for the shape of the points on the boxplot. Default:
NULL: no different shapes.- group.by.metadata.column
String indicating a column from the metadata table. This column will be used to define sample groups, and for each group it will be computed a mean of the counts. Default:
"column.id"(no groups).- group.levels
Ordered string vector indicating the order to use for the groups. Default:
NULL, counts table order will be applied- scale.expression
Logic value indicating whether Z-scores should be computed. With several proteins the Z-score is computed protein by protein, so that the panels stay comparable. Default:
FALSE(no scaling).- x.label.angle
Numeric value indicating the rotation angle to use for the x-axis labels. Default:
30.- ncol
Numeric value indicating the number of columns of the facet grid, used only when several proteins are plotted. Default:
NULL(automatic).- free.y
Logic value indicating whether each panel should have its own y-axis, used only when several proteins are plotted. Proteins of different abundance are otherwise flattened onto a common scale. Default:
TRUE.- pairwise.comparisons
Logical value indicating whether the p-values of all the pairwise (2-by-2) comparisons between the groups should be added on top of the boxplot using
ggpubr. WhenTRUE, a comparison is computed for each possible pair of groups defined bygroup.by.metadata.column, independently within each protein. Default:FALSE.- pairwise.test.type
String indicating the statistical test to use for the pairwise comparisons. The value is case/format-insensitive: capitalization, dots, spaces and hyphens are ignored (e.g.
"wilcox.test","Wilcoxon","WILCOX","mann-whitney"are all equivalent). Supported families:"t.test"(Student's/Welch t-test),"wilcox.test"(Wilcoxon/Mann-Whitney),"anova"and"kruskal.test". Since the comparisons are performed 2-by-2, the two latter are applied through their two-sample equivalents ("anova"-> pooled t-test,"kruskal.test"-> Wilcoxon rank-sum). When the pairwise brackets are displayed, the global p-value shown at the top of the plot is computed with the same test and the same arguments: with two groups the two labels report therefore the same value, while with more groups the multi-sample version of the family is used ("anova"or"kruskal.test"). The Wilcoxon p-values follow the defaults ofwilcox.test: exact when both groups have less than 50 values (older R versions require also the absence of ties), normal approximation with continuity correction otherwise. With few replicates the exact p-value has a floor: two groups of 3 samples cannot go below 0.1, even when they do not overlap at all. Names of paired tests are accepted too (e.g."paired t-test","signed-rank","Friedman") and switch onpaired.test. Default:"wilcox.test".- pairwise.include.ns
Logical value indicating whether the non-significant comparisons (p > 0.05) should be displayed. If
FALSE, only the significant comparisons are shown. Default:TRUE.- pairwise.p.label
String indicating how the pairwise p-values should be displayed (case/format-insensitive). Use
"p.signif"(aliases:"stars","significance","symbol") to show the significance symbols (ns: p > 0.05,*: p <= 0.05,**: p <= 0.01,***: p <= 0.001,****: p <= 0.0001), or"p.value"(aliases:"number","numeric","exact") to show the numeric p-value. The symbols are derived from the same p-values of the numeric labels. Default:"p.signif".- pairwise.p.decimals
Numeric value indicating the number of decimals used to approximate the numeric p-values (used only when
pairwise.p.labelshows the numeric value). Values below 0.1 are rendered in scientific notation with a superscript exponent, e.g. 3.20×10⁻². The actual (real) p-value is always displayed, so the uninformativep < 2.2e-16is never shown. Default:2.- paired.test
Logical value indicating whether paired statistical tests should be performed. The samples are matched between groups through the IDs stored in
replicate.column, as indiff.analyses, and each comparison uses only the replicates measured in both groups. The t-tests become paired t-tests and the Wilcoxon rank-sum test a Wilcoxon signed-rank test. With more than two groups the global p-value comes from a repeated-measures ANOVA ("t.test","anova") or from a Friedman test ("wilcox.test","kruskal.test"), computed on the replicates measured in all the groups. The pairing applies to the global p-value also whenpairwise.comparisons = FALSE. Default:FALSE.- replicate.column
String indicating the name of a column from the metadata table in which are stored the replicate IDs used to pair the samples. It is required when
paired.test = TRUE, or whenpairwise.test.typeindicates a paired test. A replicate ID cannot be repeated within a group. Default:NULL.
Value
A boxplot of class ggplot2, faceted by protein when several proteins are provided.
Examples
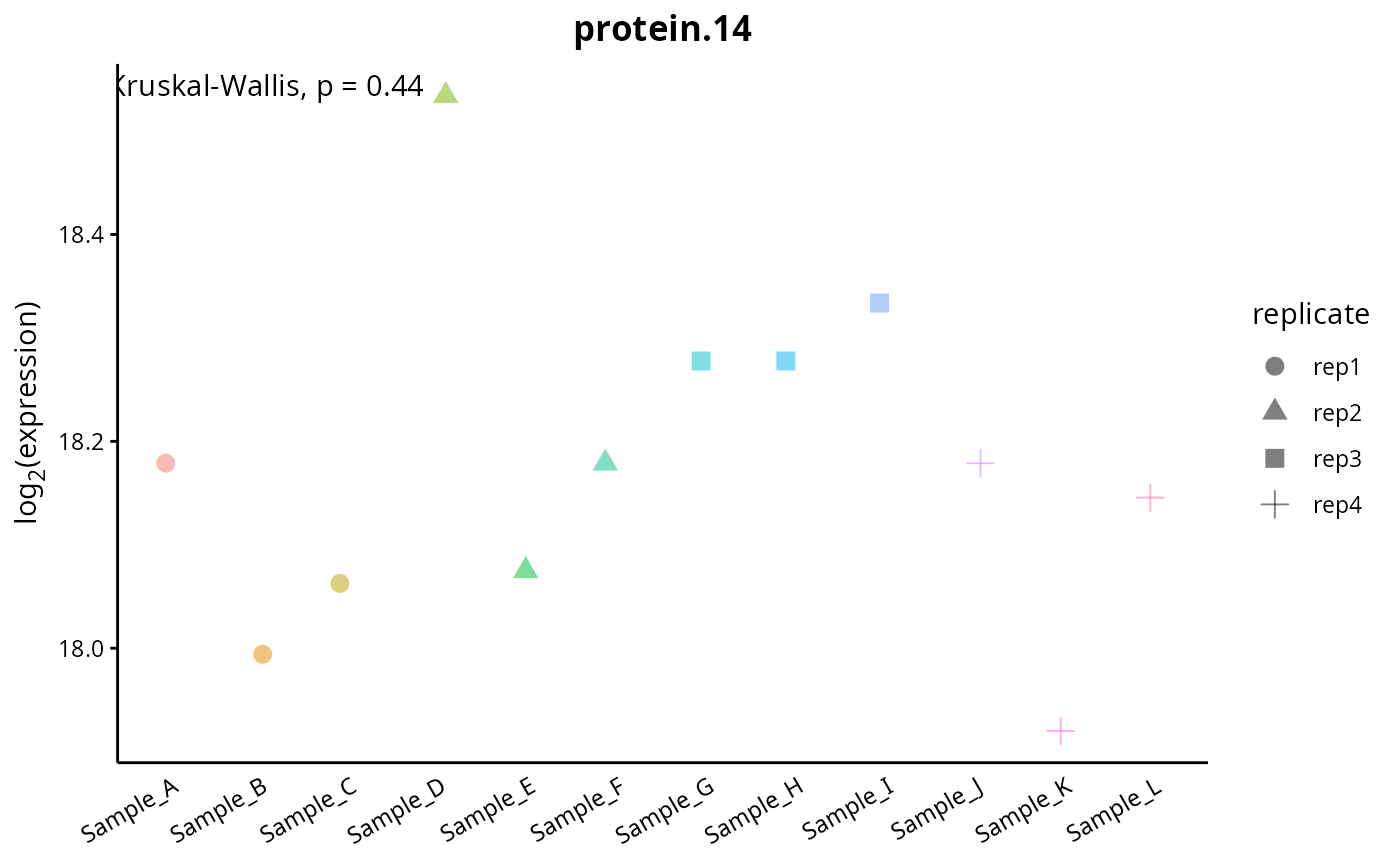
# Expression for all samples of protein 'protein.44'
expression.boxplot(DEprot.object = DEprot::test.toolbox$dpo.imp,
protein.id = "protein.44",
shape.column = "replicate")
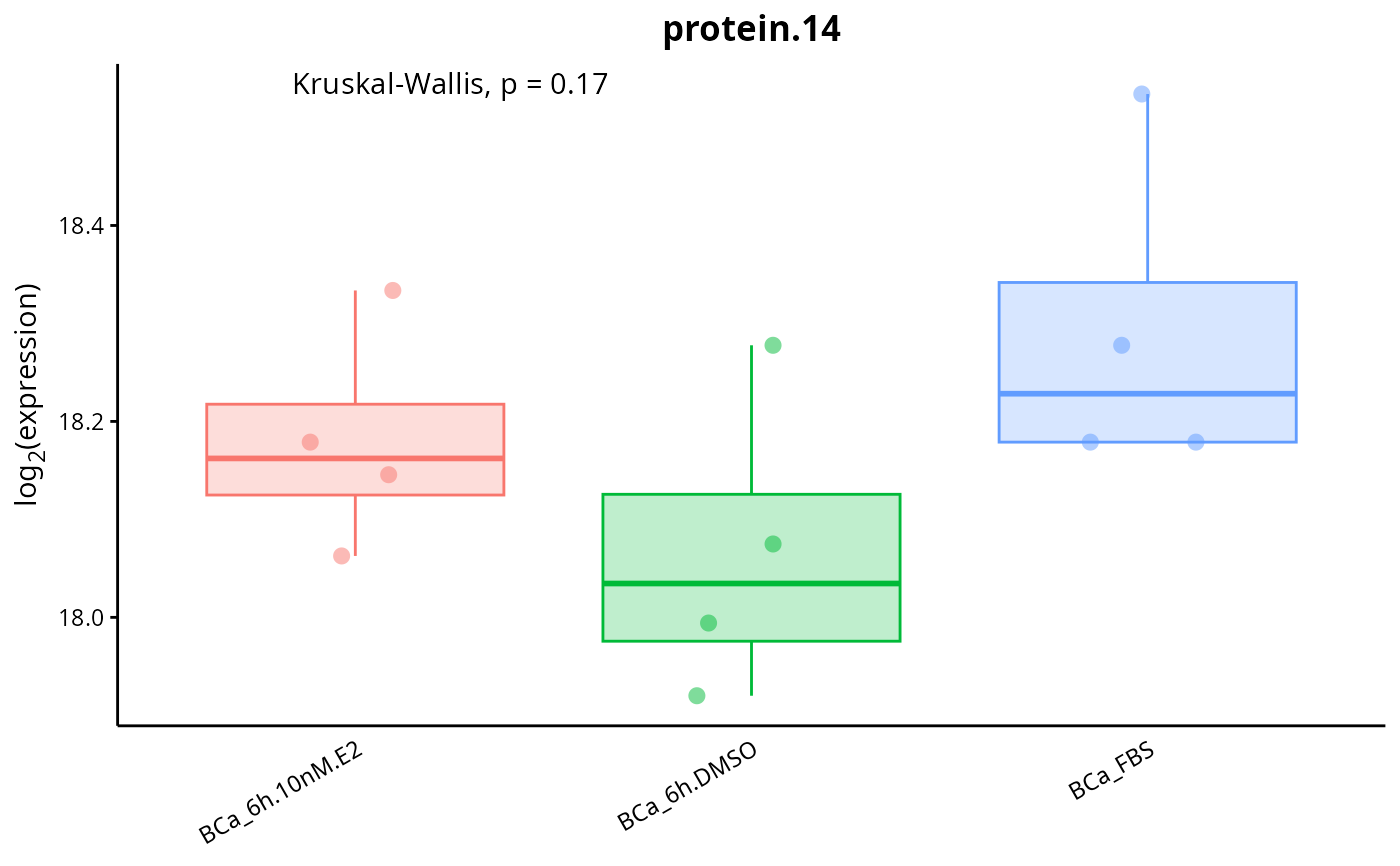
 # Expression of protein 'protein.44' grouped by condition (combined.id)
expression.boxplot(DEprot.object = DEprot::test.toolbox$dpo.imp,
protein.id = "protein.44",
group.by.metadata.column = "combined.id")
# Expression of protein 'protein.44' grouped by condition (combined.id)
expression.boxplot(DEprot.object = DEprot::test.toolbox$dpo.imp,
protein.id = "protein.44",
group.by.metadata.column = "combined.id")
 # Expression of several proteins: one panel per protein
expression.boxplot(DEprot.object = DEprot::test.toolbox$dpo.imp,
protein.id = c("protein.44", "protein.45", "protein.46"),
group.by.metadata.column = "combined.id",
ncol = 3)
# Expression of several proteins: one panel per protein
expression.boxplot(DEprot.object = DEprot::test.toolbox$dpo.imp,
protein.id = c("protein.44", "protein.45", "protein.46"),
group.by.metadata.column = "combined.id",
ncol = 3)
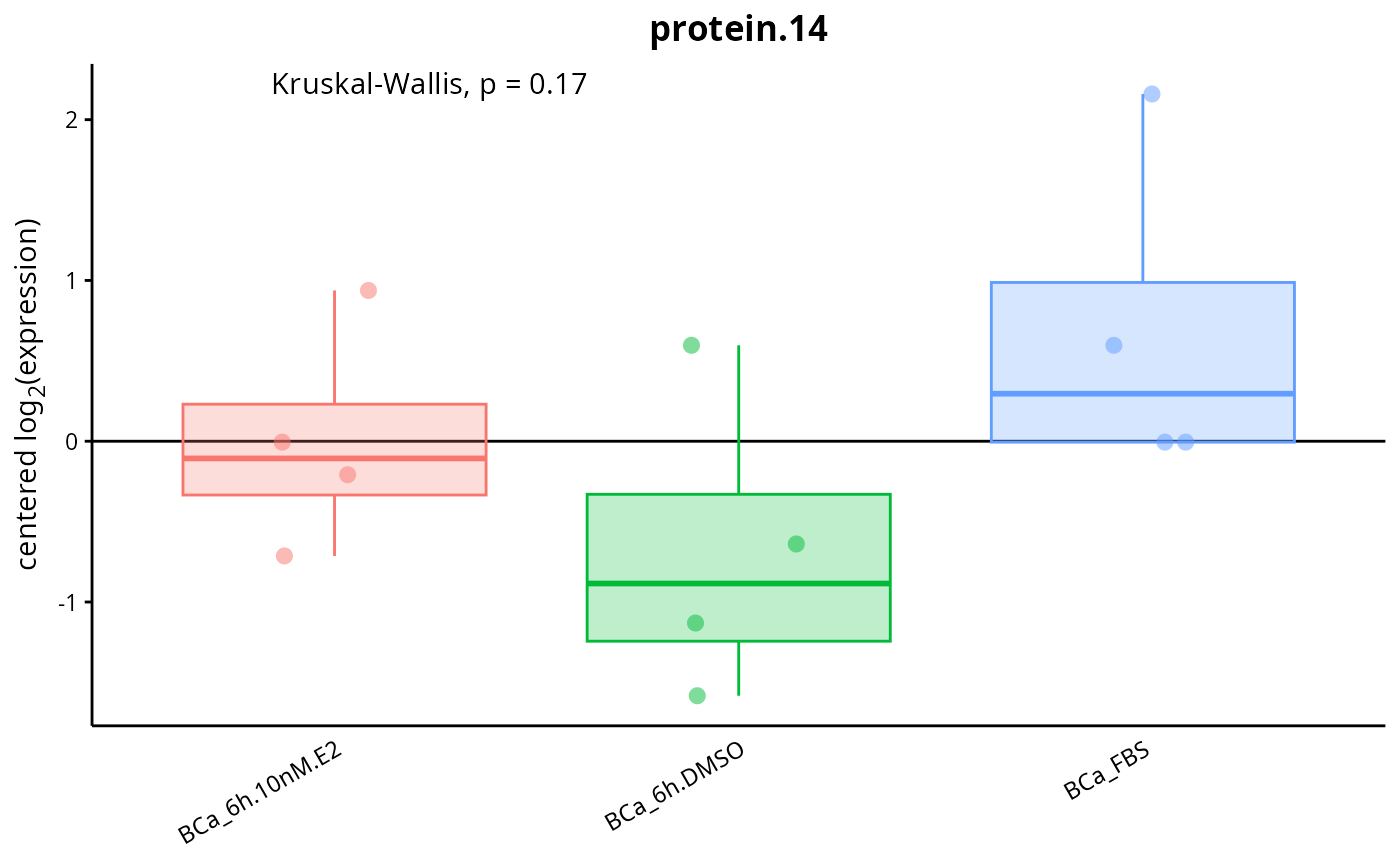 # Expression of protein 'protein.44' grouped by condition (combined.id) and Z-scored
expression.boxplot(DEprot.object = DEprot::test.toolbox$dpo.imp,
protein.id = "protein.44",
group.by.metadata.column = "combined.id",
scale.expression = TRUE)
# Expression of protein 'protein.44' grouped by condition (combined.id) and Z-scored
expression.boxplot(DEprot.object = DEprot::test.toolbox$dpo.imp,
protein.id = "protein.44",
group.by.metadata.column = "combined.id",
scale.expression = TRUE)
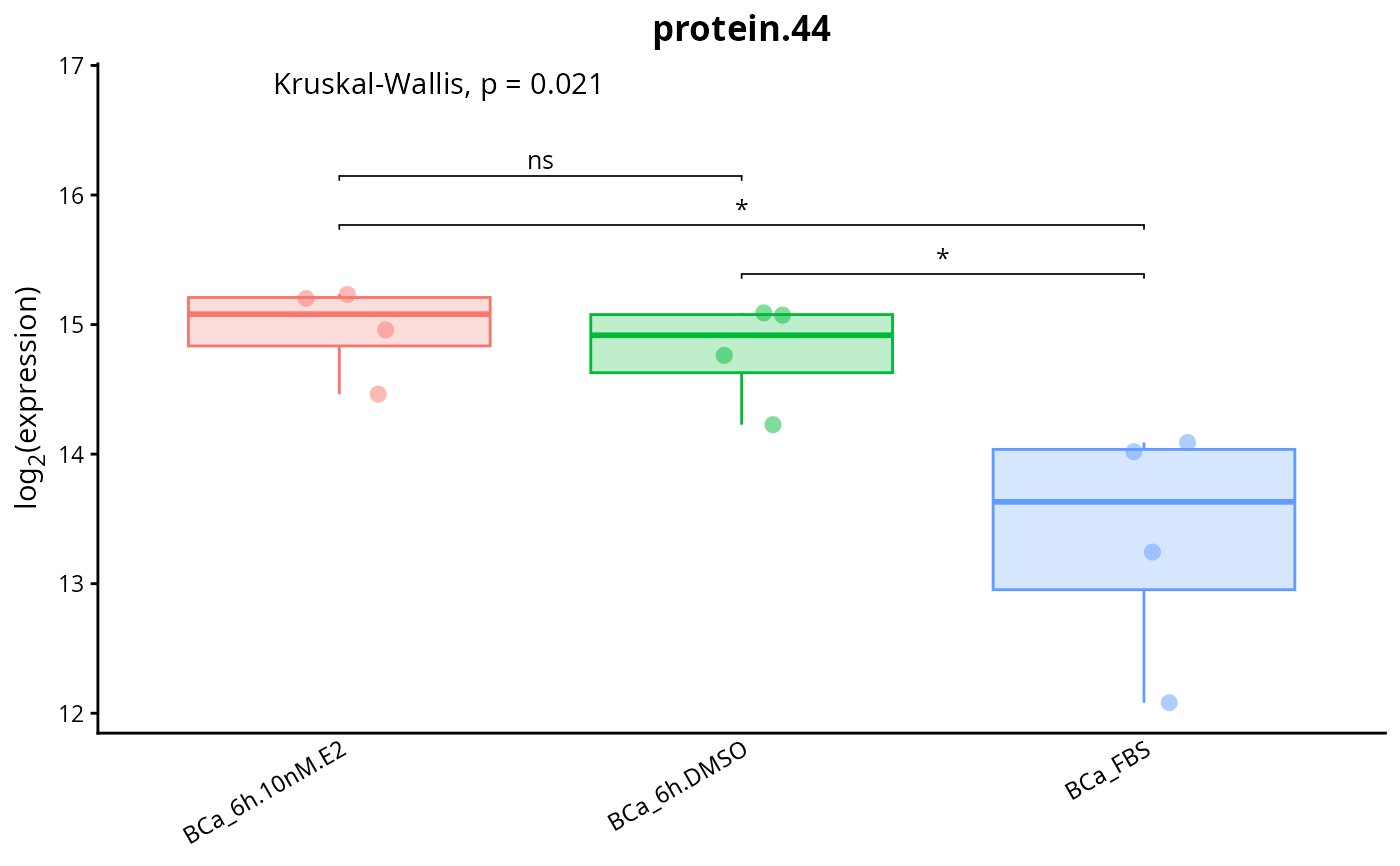 # Pairwise comparisons between conditions (significance symbols, Wilcoxon test)
expression.boxplot(DEprot.object = DEprot::test.toolbox$dpo.imp,
protein.id = "protein.44",
group.by.metadata.column = "combined.id",
pairwise.comparisons = TRUE)
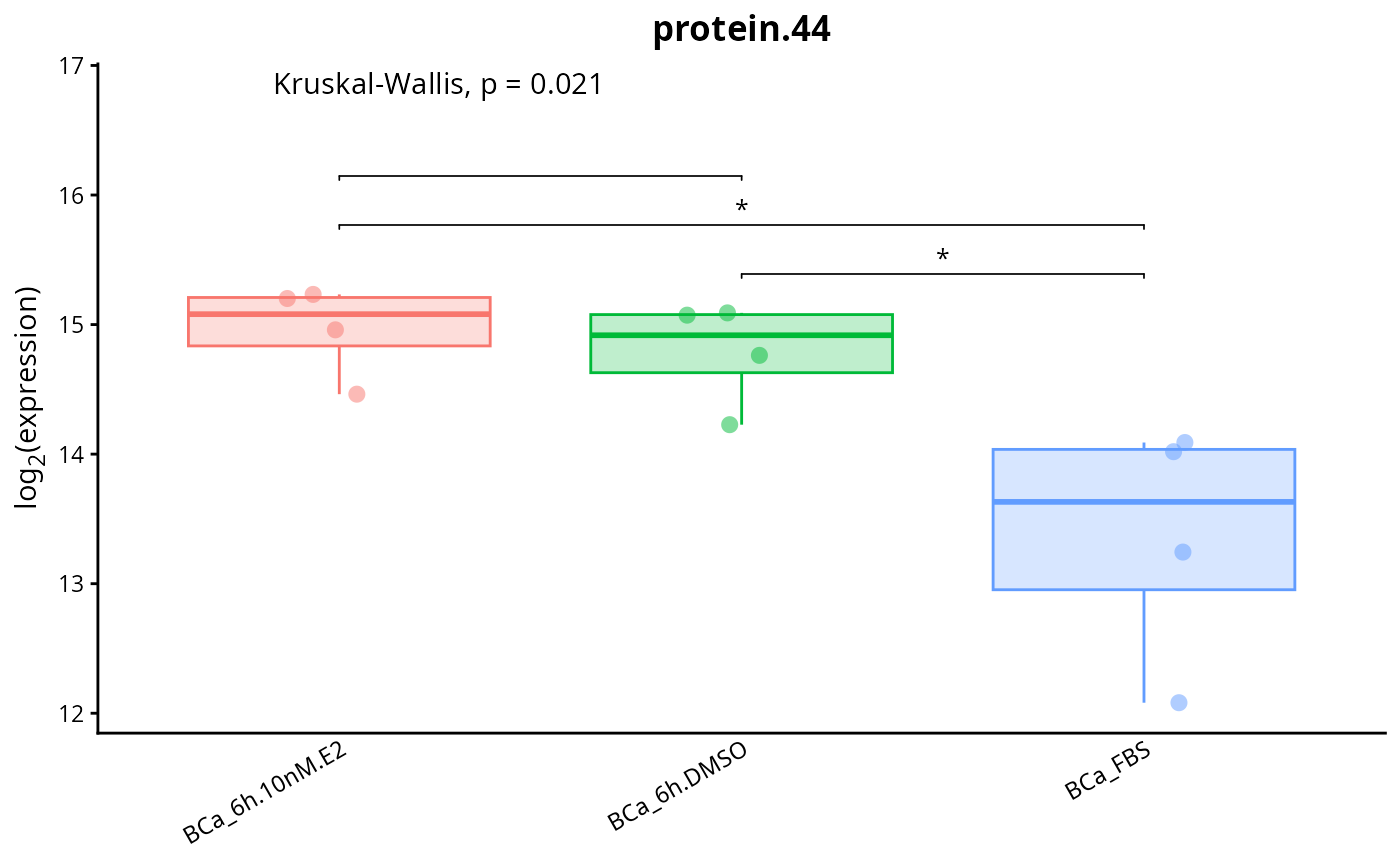
# Pairwise comparisons between conditions (significance symbols, Wilcoxon test)
expression.boxplot(DEprot.object = DEprot::test.toolbox$dpo.imp,
protein.id = "protein.44",
group.by.metadata.column = "combined.id",
pairwise.comparisons = TRUE)
 # Pairwise comparisons showing the exact numeric p-value
expression.boxplot(DEprot.object = DEprot::test.toolbox$dpo.imp,
protein.id = "protein.44",
group.by.metadata.column = "combined.id",
pairwise.comparisons = TRUE,
pairwise.test.type = "t.test",
pairwise.p.label = "stars",
pairwise.p.decimals = 3,
pairwise.include.ns = FALSE)
# Pairwise comparisons showing the exact numeric p-value
expression.boxplot(DEprot.object = DEprot::test.toolbox$dpo.imp,
protein.id = "protein.44",
group.by.metadata.column = "combined.id",
pairwise.comparisons = TRUE,
pairwise.test.type = "t.test",
pairwise.p.label = "stars",
pairwise.p.decimals = 3,
pairwise.include.ns = FALSE)
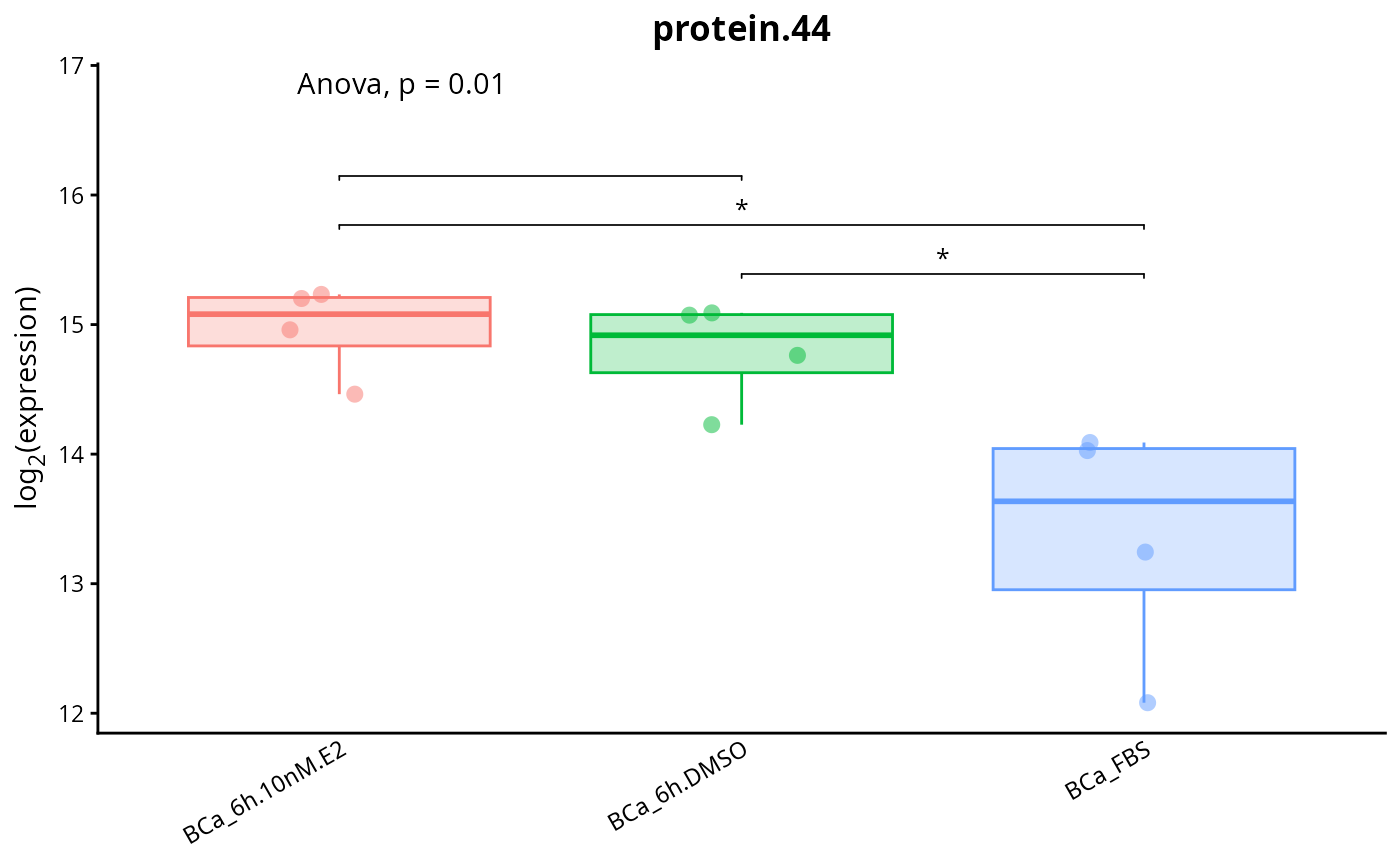 # Paired t-test: the samples of the different conditions are matched through their replicate ID
expression.boxplot(DEprot.object = DEprot::test.toolbox$dpo.imp,
protein.id = "protein.44",
group.by.metadata.column = "combined.id",
shape.column = "replicate",
pairwise.comparisons = TRUE,
pairwise.test.type = "t.test",
paired.test = TRUE,
replicate.column = "replicate")
# Paired t-test: the samples of the different conditions are matched through their replicate ID
expression.boxplot(DEprot.object = DEprot::test.toolbox$dpo.imp,
protein.id = "protein.44",
group.by.metadata.column = "combined.id",
shape.column = "replicate",
pairwise.comparisons = TRUE,
pairwise.test.type = "t.test",
paired.test = TRUE,
replicate.column = "replicate")