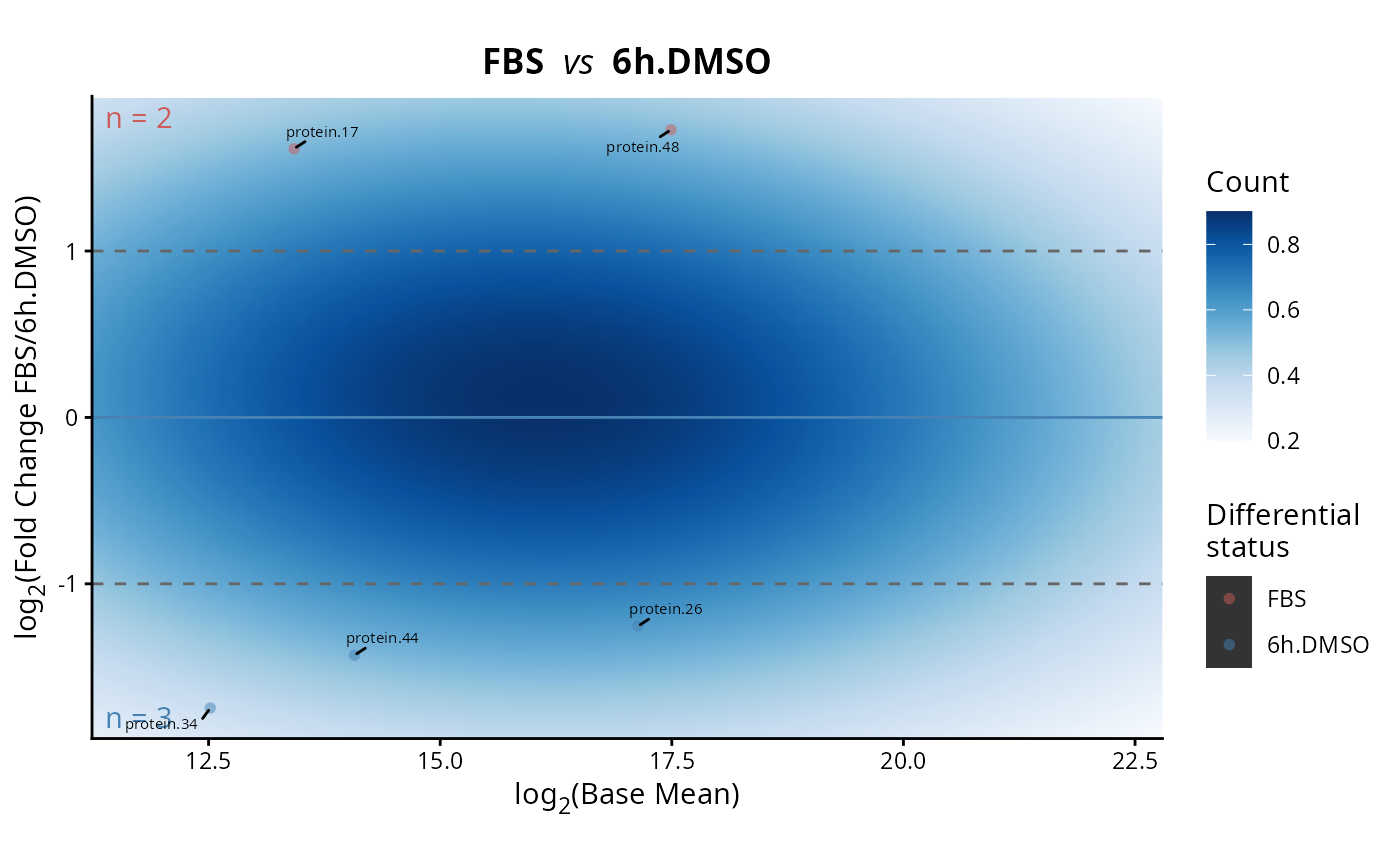
Plots a MA plot log2(basemean) x log2(FoldChange) of differential expression results
plot.MA(
  DEprot.analyses.object,
  contrast = 1,
  up.color = "indianred",
  down.color = "steelblue",
  density.colors = colorRampPalette(colors = RColorBrewer::brewer.pal(9, "Blues"))(101),
  point.size = 2,
  point.alpha = 0.5,
  title = NULL,
  use.uncorrected.pvalue = FALSE,
  symmetric.y = TRUE,
  dot.labels = NULL,
  protein.names.pattern = "",
  labels.in.boxes = FALSE,
  label.font.size = 2,
  label.max.overlaps = 100,
  min.segment.length.labels = 0,
  label.top.n = NULL
)
Arguments
- DEprot.analyses.object
An object of class
DEprot.analyses.- contrast
Number indicating the position of the contrast to use for the plotting.
- up.color
String indicating the color to use for up-regulated proteins in the plots. Default:
"indianred".- down.color
String indicating the color to use for up-regulated proteins in the plots. Default:
"steelblue".- density.colors
List of colors, passed to
scale_fill_gradientn, to use for the density gradient. Default:"colorRampPalette(colors = RColorBrewer::brewer.pal(9, "Blues"))(101)".- point.size
Numeric value indicating the size of the dots. Default:
2.- point.alpha
Numeric value between 0 and 1 to indicate the transparency (alpha) of the dots. Default:
0.5.- title
String indicating the title to use. Default:
NULL(automatic title).- use.uncorrected.pvalue
Logical value indicating whether it should be used the normal p-value instead of the adjusted one (differential proteins numbers are recomputed). Default:
FALSE, padj is used.- symmetric.y
Logical values indicating whether the y-axis scale should be symmetric or not. Default:
TRUE.- dot.labels
String vector indicating labels to show on the plot that should correspond to
prot.idcolumn values. Default:NULL(no labels shown).- protein.names.pattern
Character indicating a regular expression to remove from the protein IDs. Default:
"", no alterations in the protein IDs.- labels.in.boxes
Logical value indicating whether the labels should be visualized as boxes. Default:
FALSE.- label.font.size
Numeric value indicating the size to use for the dot labels. Default:
2.- label.max.overlaps
Numeric value indicating the maximum number of overlaps allowed between labels. Default:
100.- min.segment.length.labels
Numeric value indicating the minimal length of the segments that connect the labels to the points. Default:
0(segment always shown).- label.top.n
Single integer value (or
NULL) indicating the number of top differentially expressed proteins to label automatically. Differential proteins (up- or down-regulated) are ranked by-log10(padj) * abs(log2FC)and the topNare labeled; if fewer thanNdifferential proteins are available, all of them are labeled. Whenuse.uncorrected.pvalue = TRUE, the uncorrected p-value is used in the ranking instead of the adjusted one. Any IDs provided throughdot.labelsare added to the automatically selected ones, andlabels.in.boxestogether with the other label aesthetics apply to them as well. Default:NULL(no automatic labels).
Value
A ggplot object.
Examples
plot.MA(DEprot.analyses.object = DEprot::test.toolbox$diff.exp.limma,
contrast = 1) +
ggplot2::ylab("log<sub>2</sub>(Fold Change FBS/6h.DMSO)")
#> Warning: Removed 400 rows containing missing values or values outside the scale range
#> (`geom_raster()`).
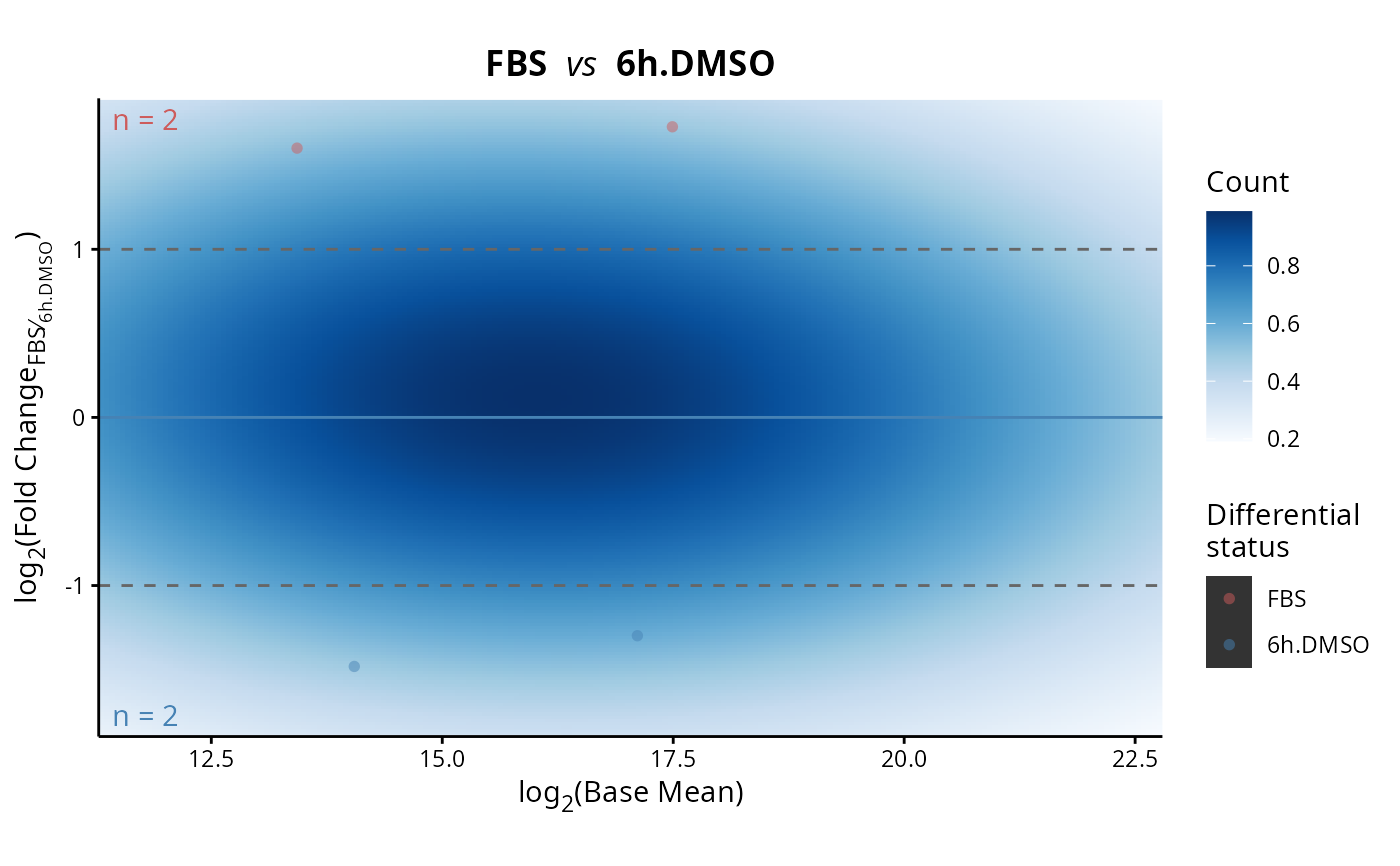 plot.MA(DEprot.analyses.object = DEprot::test.toolbox$diff.exp.limma,
contrast = 1,
label.top.n = 10) +
ggplot2::ylab("log<sub>2</sub>(Fold Change FBS/6h.DMSO)")
#> Warning: Removed 400 rows containing missing values or values outside the scale range
#> (`geom_raster()`).
plot.MA(DEprot.analyses.object = DEprot::test.toolbox$diff.exp.limma,
contrast = 1,
label.top.n = 10) +
ggplot2::ylab("log<sub>2</sub>(Fold Change FBS/6h.DMSO)")
#> Warning: Removed 400 rows containing missing values or values outside the scale range
#> (`geom_raster()`).