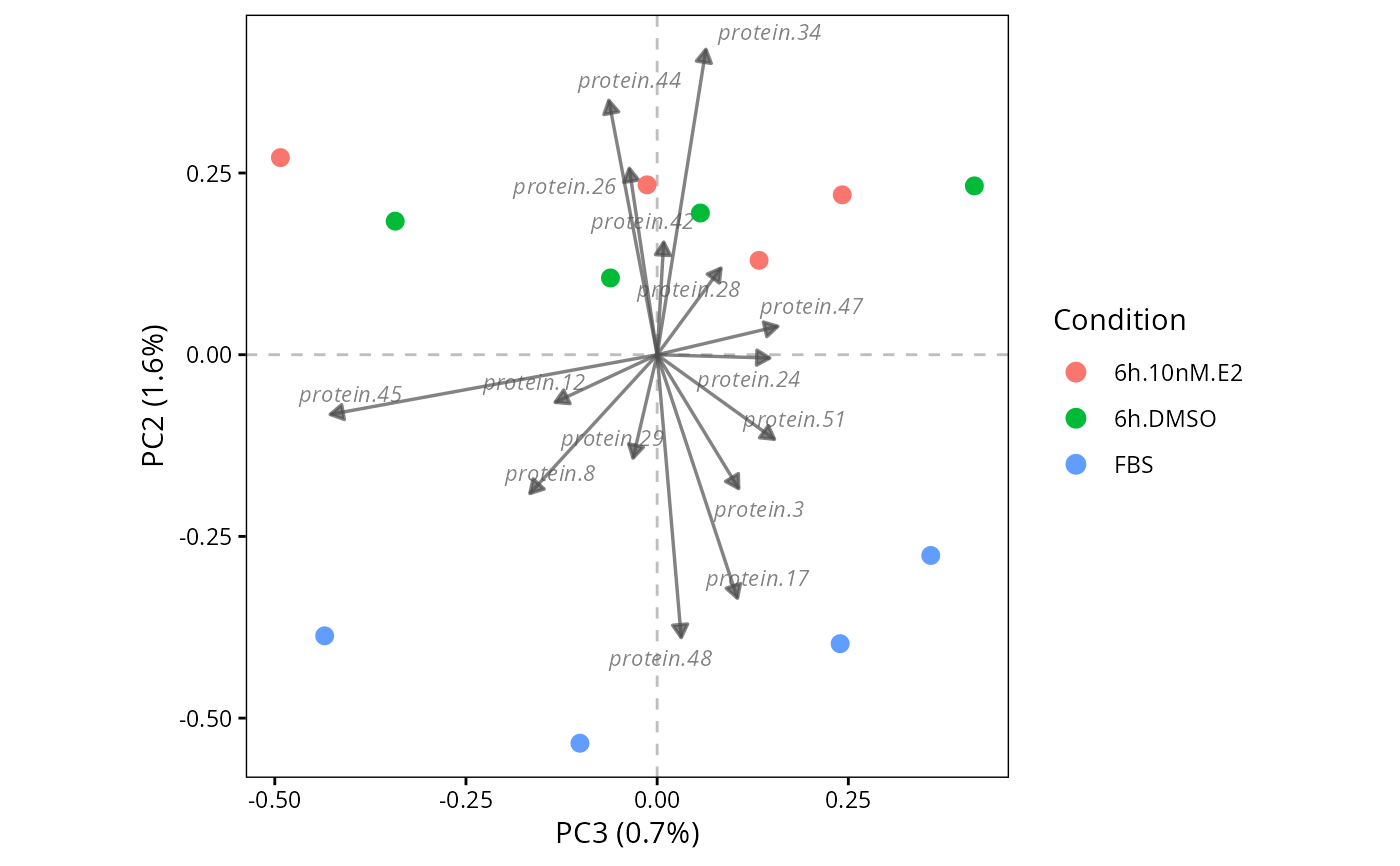
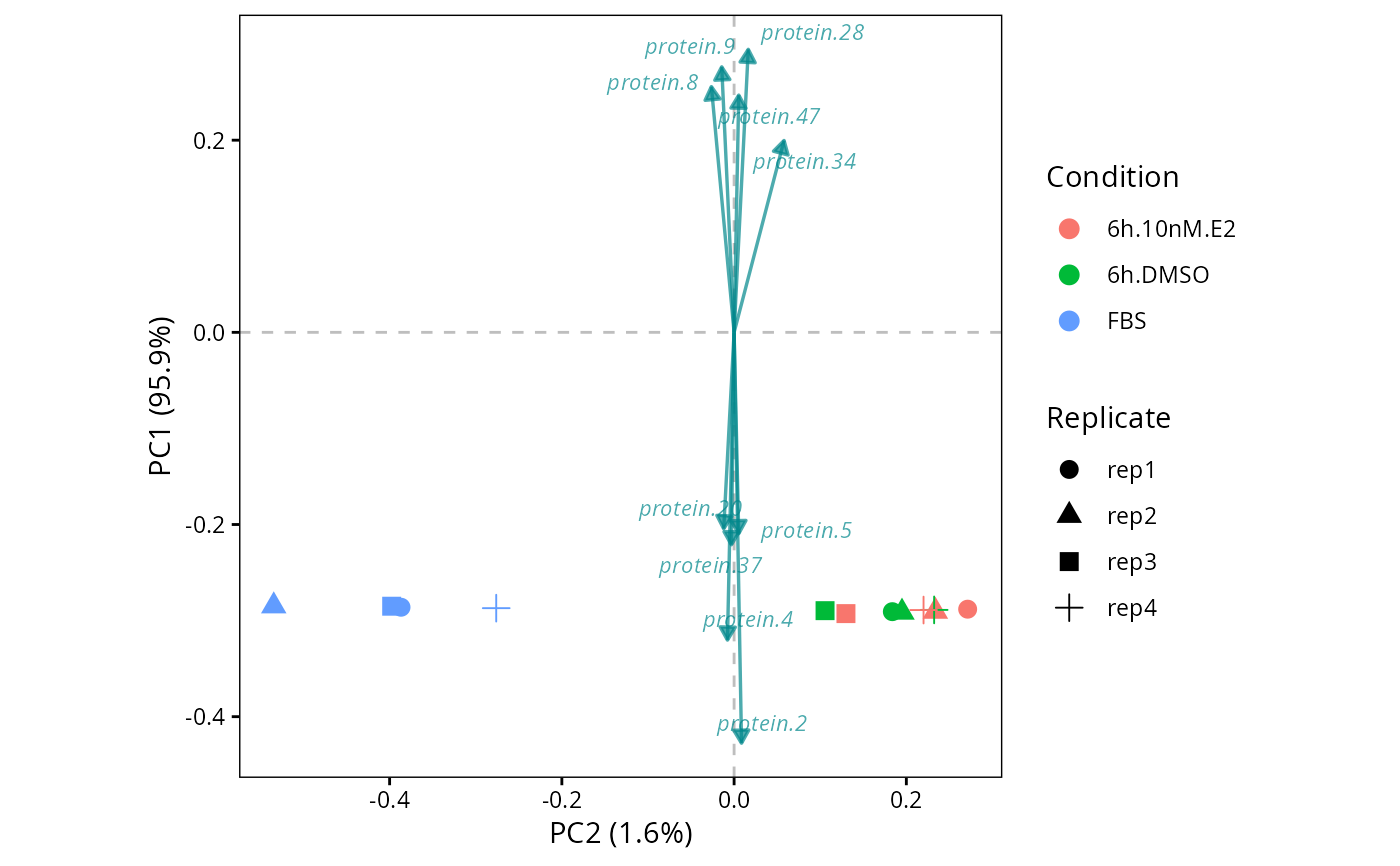
Plot a biplot of the PCs from an object generated by perform.PCA. A biplot overlays sample scores (dots) with variable loadings (arrows), showing which proteins contribute most to the separation of samples along the selected principal components.
plot.PC.biplot(
  DEprot.PCA.object,
  PC.x = 2,
  PC.y = 1,
  color.column = "column.id",
  shape.column = NULL,
  label.column = NULL,
  plot.zero.line.x = TRUE,
  plot.zero.line.y = TRUE,
  n.loadings = 10,
  loading.color = "turquoise4",
  loading.arrow.size = 0.6,
  loading.label.size = 3,
  loading.alpha = 0.7,
  loading.scale = 0.8
)
Arguments
- DEprot.PCA.object
An object of class
DEprot.PCA, as generated by perform.PCA.- PC.x
Number indicating which Principal Component (PC) to display on the x-axis. Default:
2(PC2).- PC.y
Number indicating which Principal Component (PC) to display on the y-axis. Default:
1(PC1).- color.column
String indicating the name of the column in the
metadatato use as factor for the dot colors. Default:"column.id"(each sample a color).- shape.column
String indicating the name of the column in the
metadatato use as factor for the dot shapes. Default:NULL(all dots).- label.column
String indicating the name of the column in the
metadatato use as label of the dots. Default:NULL(no labeling).- plot.zero.line.x
Logical value to indicate whether to plot two gray dashed line in correspondence of x=0. Default:
TRUE.- plot.zero.line.y
Logical value to indicate whether to plot two gray dashed line in correspondence of y=0. Default:
TRUE.- n.loadings
Integer indicating the number of top contributing protein loadings (arrows) to display on the biplot. Proteins are ranked by their Euclidean distance from the origin in the selected 2D PC plane. Default:
10.- loading.color
String indicating the color used for the loading arrows and labels. Default:
"turquoise4".- loading.arrow.size
Numeric value indicating the linewidth of the loading arrows. Default:
0.6.- loading.label.size
Numeric value indicating the font size of the loading labels. Default:
3.- loading.alpha
Numeric value (0 to 1) indicating the transparency of the loading arrows and labels. Default:
0.7.- loading.scale
Numeric value used as a multiplier to manually adjust the scaling of the loading arrows relative to the sample scores. Values > 1 make arrows longer, values < 1 make them shorter. Default:
0.8.
Value
A ggplot object.
Details
The function extracts protein loadings from the PCA object stored in the prcomp slot.
When the PCA was computed using stats::prcomp (no missing values), the protein projections
from prcomp$rotation are used. When the PCA was computed using pcaMethods::pca (missing values
present), the protein loadings from the loadings slot are used.
In both cases, the loadings are scaled so that the arrows fit visually within the range of the
sample scores. Only the top n.loadings proteins (by Euclidean distance from origin in the
selected PC plane) are displayed to keep the plot readable.
Gene/protein names are extracted from the row names of the loadings matrix.
Note. The arrows of a PCA biplot are the rotation coefficients, i.e. the exact linear map between
the proteins and the components. They are conceptually different from the arrows displayed by
plot.PCoA.biplot, which are an a-posteriori projection.
See also
Examples
# Perform Principal Component Analyses (PCA)
pca <- perform.PCA(DEprot.object = DEprot::test.toolbox$dpo.imp)
# Plot biplot of PC1-vs-PC2
plot.PC.biplot(DEprot.PCA.object = pca,
color.column = "condition",
shape.column = "replicate",
n.loadings = 10)
 # Plot biplot of PC2-vs-PC3 with more loadings
plot.PC.biplot(DEprot.PCA.object = pca,
PC.x = 3,
PC.y = 2,
color.column = "condition",
n.loadings = 15,
loading.color = "gray30")
# Plot biplot of PC2-vs-PC3 with more loadings
plot.PC.biplot(DEprot.PCA.object = pca,
PC.x = 3,
PC.y = 2,
color.column = "condition",
n.loadings = 15,
loading.color = "gray30")