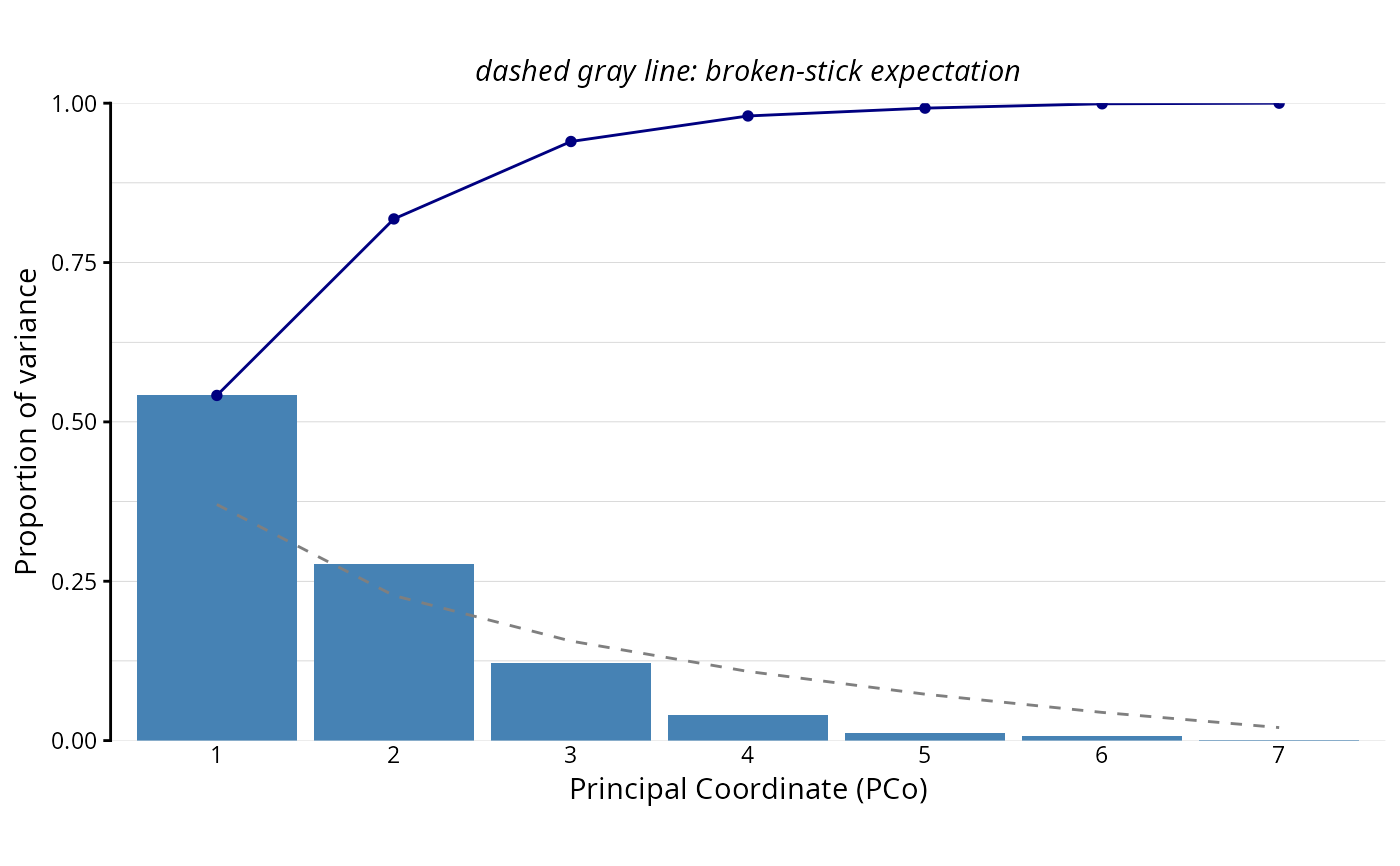
Function to plot the cumulative variance of all the principal coordinates of a PCoA.
plot.PCoA.cumulative(
  DEprot.PCoA.object,
  bar.color = "steelblue",
  line.color = "navyblue",
  title = NULL,
  broken.stick = TRUE
)
Arguments
- DEprot.PCoA.object
An object of class
DEprot.PCoA, as generated by perform.PCoA.- bar.color
String indicating the color to use for the bar fill. Default:
"steelblue".- line.color
String indicating the color to use for the line and the dots of the cumulative curve. Default:
"navyblue".- title
String indicating the title of the plot (markdown annotation supported). Default:
NULL.- broken.stick
Logical value indicating whether the broken-stick expectation should be displayed as a dashed gray line. Default:
TRUE.
Value
A barplot in ggplot format.
Details
Only the principal coordinates corresponding to a positive eigenvalue are displayed, and the proportions of
variance are computed using the positive eigenvalues as denominator (see perform.PCoA).
The broken-stick expectation provides a criterion for the axis retention: the axes whose proportion of variance
exceeds the corresponding broken-stick value are usually considered non-trivial.
See also
Examples
# Compute the sample correlations and the PCoA
correlation <- plot.correlation.heatmap(DEprot.object = DEprot::test.toolbox$dpo.imp,
                                        correlation.method = "spearman")

pcoa <- perform.PCoA(DEprot.correlation.object = correlation)
#> Only 8 of the 11 principal coordinates requested correspond to a positive eigenvalue and could be computed.
#> The dissimilarities are not euclidean-embeddable: 3 negative eigenvalue(s) detected (largest relative magnitude = 0.081).
#>        The negative eigenvalues are non-negligible. Consider using 'distance.transformation = "sqrt"' or 'correction = "cailliez"'/'correction = "lingoes"'.
#>        The proportions of variance are computed using only the positive eigenvalues as denominator.

# Plot cumulative variance barplot
plot.PCoA.cumulative(pcoa)