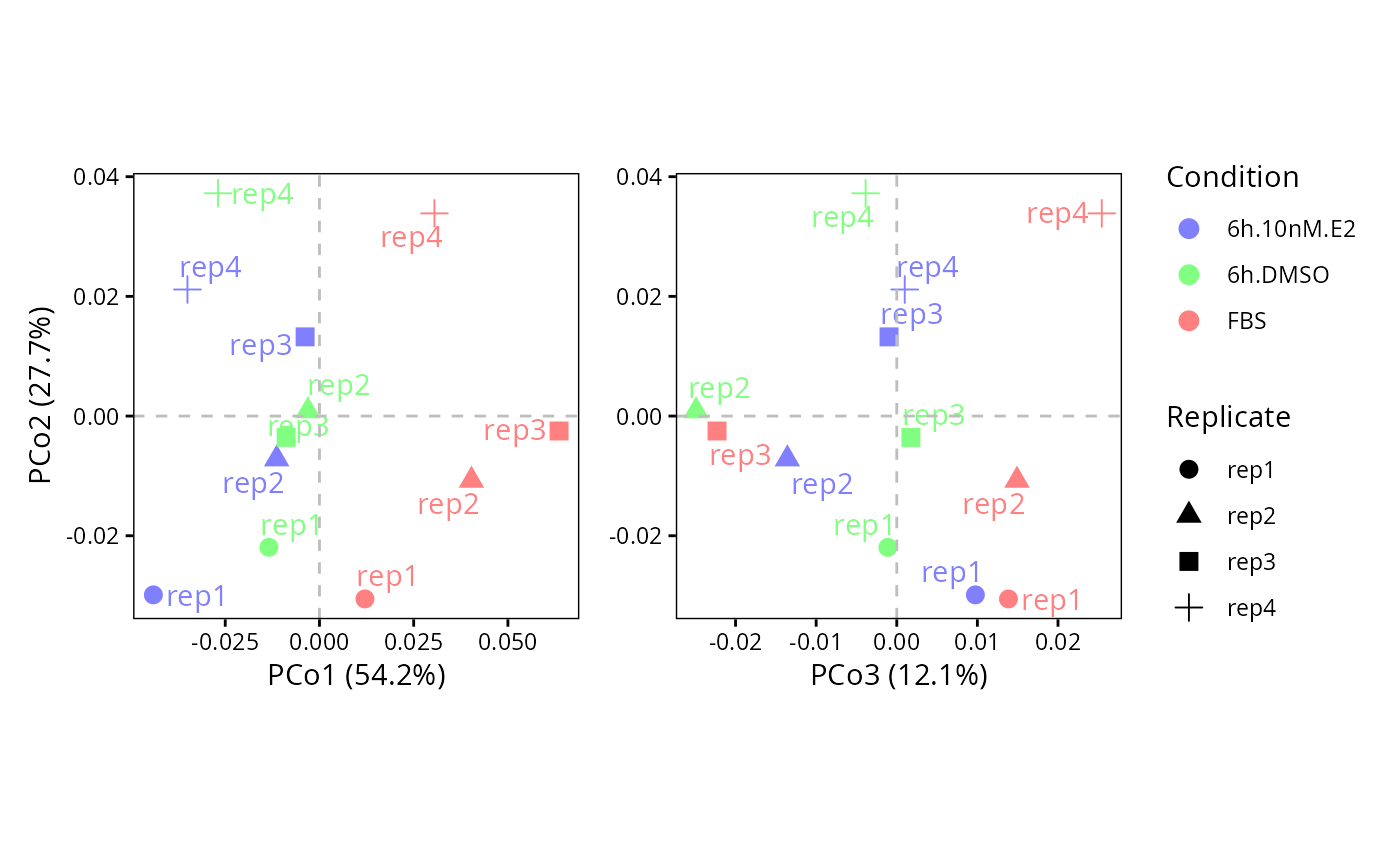
Plot combined scatter of the principal coordinates 1-2,2-3 from an object generated by perform.PCoA.
plot.PCoA.scatter.123(
  DEprot.PCoA.object,
  color.column = "column.id",
  shape.column = NULL,
  label.column = NULL,
  dot.colors = NULL,
  title = NULL,
  plot.zero.line.y.12 = TRUE,
  plot.zero.line.x.12 = TRUE,
  plot.zero.line.y.23 = TRUE,
  plot.zero.line.x.23 = TRUE
)
Arguments
- DEprot.PCoA.object
An object of class
DEprot.PCoA, as generated by perform.PCoA.- color.column
String indicating the name of the column in the
metadatato use as factor for the dot colors. Default:"column.id"(each sample a color).- shape.column
String indicating the name of the column in the
metadatato use as factor for the dot shapes. Default:NULL(all dots).- label.column
String indicating the name of the column in the
metadatato use as label of the dots. Default:NULL(no labeling).- dot.colors
Color-vector indicating the colors to use for the points in the plot. If
NULL(default) or the number of colors is lower than the required, automatic colors will be assign using therainbowfunction. Default:NULL.- title
String indicating a title to add to the plot (markdown syntax supported). Default:
NULL(no title).- plot.zero.line.y.12
Logical value to indicate whether to plot a gray dashed line in correspondence of y=0 in the PCo1-vs-PCo2 plot. Default:
TRUE.- plot.zero.line.x.12
Logical value to indicate whether to plot a gray dashed line in correspondence of x=0 in the PCo1-vs-PCo2 plot. Default:
TRUE.- plot.zero.line.y.23
Logical value to indicate whether to plot a gray dashed line in correspondence of y=0 in the PCo2-vs-PCo3 plot. Default:
TRUE.- plot.zero.line.x.23
Logical value to indicate whether to plot a gray dashed line in correspondence of x=0 in the PCo2-vs-PCo3 plot. Default:
TRUE.
Value
A patchwork object result of a combination of two ggplot objects.
See also
Examples
# Compute the sample correlations and the PCoA
correlation <- plot.correlation.heatmap(DEprot.object = DEprot::test.toolbox$dpo.imp,
                                        correlation.method = "spearman")

pcoa <- perform.PCoA(DEprot.correlation.object = correlation)
#> Only 8 of the 11 principal coordinates requested correspond to a positive eigenvalue and could be computed.
#> The dissimilarities are not euclidean-embeddable: 3 negative eigenvalue(s) detected (largest relative magnitude = 0.081).
#>        The negative eigenvalues are non-negligible. Consider using 'distance.transformation = "sqrt"' or 'correction = "cailliez"'/'correction = "lingoes"'.
#>        The proportions of variance are computed using only the positive eigenvalues as denominator.

# Visualize the PCoA
plot.PCoA.scatter.123(DEprot.PCoA.object = pcoa,
                      color.column = "condition",
                      shape.column = "replicate",
                      label.column = "replicate")